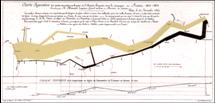
Tufte - Escape Flatland: Napoleon's
March
Enforce Visual
Comparisons
Width of tan and black lines gives you an immediate comparison of the size of Napoleon's army at different times
during march.
Show Causality
Map shows temperature records and some geographic locations that shows that weather and terrain defeated Napoleon as much as his
opponents.
Show Multivariate data
Napoleon's March shows six: army size, location (in 2 dimensions),
direction, time,
and temperature.
Use Direct Labeling
Integrate words, numbers & images
Integrate words, numbers & images
Don't make user work to learn your "system.”
Legends or keys usually force the reader to learn a system instead of studying
the information
they need.
Design
Content-Driven