4 Visualizing Boolean Queries ................ 59
- 4.1 Introduction ................ 59
- 4.2 Query Space Visualized by the InfoCrystal ................ 61
- 4.2.1 Ways of Specifying a Boolean Query ................ 62
- 4.2.2 InfoCrystal as a Boolean Calculator ................ 62
- 4.3 Creating Complex and Nested Queries ................ 64
- 4.4 The Outliner Tool ................ 70
- 4.5 Narrowing and Broadening Techniques ................ 71
The postscript version of this chapter.
Chapter 4
Visualizing Boolean Queries
4.1 Introduction
How can we make Boolean retrieval more transparent and easy-to-use without limiting its expressive power ? In this chapter we demonstrate how the InfoCrystal can be used to visualize and generate Boolean queries. We have discussed in chapter 2 how Boolean retrieval can be characterized along four dimensions. We will show that the way these four dimensions affect the broadness of a query can be visualized using the same simple visual analogy: the greater the area of the visual object representing the query, the broader the query. This will make it much easier for users to formulate and modify Boolean queries and to achieve the desired retrieval results.
Each interior icon of the InfoCrystal represents a distinct Boolean relationship among the input criteria (see Figure 4.1). Hence, users can specify Boolean queries by interacting with a direct manipulation interface. Appendix 1 provides an extensive tutorial that contains many examples of how a Boolean query can be specified using the InfoCrystal representation. The InfoCrystal acts as a Boolean calculator. Users do not have to use logical operators and parentheses explicitly to formulate queries. Hence, users do not have to concern themselves with the coordination problem. Instead they need to recognize the relationships of interest and select them. If an interior icon is selected, then it changes its visual appearance. In the figures of this thesis the center area of selected interior icons are displayed in black and the unselected ones in white.
In an InfoCrystal we partition the query space defined by its N inputs into 2N - 1 disjoint subsets or constituents (the only disjoint constituent that is not explicitly represented in the form of an interior icon is the complement of all N inputs).
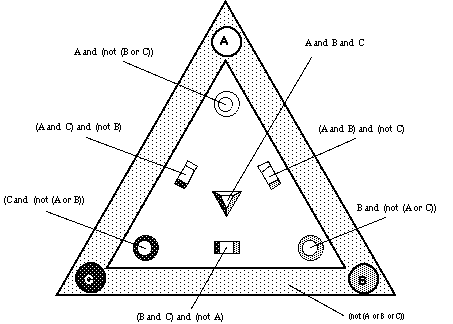
Figure 4.1: shows the Boolean relationships associated with the interior icons for an InfoCrystal with three inputs or search criteria. The InfoCrystal represents all the possible queries involving its inputs in normal disjunctive form.
It can be shown that any Boolean query that involves the inputs of an InfoCrystal and that applies the Boolean operations of union, intersection or negation can be represented by the union of a certain number of these constituents [Kuratowski and Mostowski 1976]. The InfoCrystal represents all the possible Boolean queries involving its inputs in disjunctive normal form. A query in disjunctive form is a disjunction of clauses, each of which is a conjunction of concepts, where some of them can be negated. Each interior icon represents a conjunction of the input concepts, where some of them are negated (see Figure 4.1). If a user selects several interior icons then the resulting Boolean query is equal to the disjunction of the Boolean queries associated with the selected icons.
We need to point out that the interior icons of an InfoCrystal can not represent any query that includes the constituent that represents the complement of all the inputs. We make the implicit assumption that users are interested in information where always at least one of their stated search interests is satisfied. This is a reasonable assumption to make, because, first of all, the complement of all the inputs will cause a very large set of information to be retrieved, which is very expensive to compute and therefore many commercial retrieval systems will not permit users to formulate such queries. Second, if users are interested in the complement of all their stated interests, then here will come a point where they want to intersect this huge and unwieldy set with an additional, but positive search interest. Hence, they can create a hierarchical InfoCrystal query, as we will be discussed in section 4.2, where the search criteria, whose complement is of primary interest is organized in a separate InfoCrystal, whose output is connected to an InfoCrystal one level up in the hierarchy. In short, users can use the InfoCrystal to express the complement of several concepts by integrating it into a hierarchical InfoCrystal query structure. Furthermore, if the need arises that the complement is explicitly represented in a simple visual way, then the border area could represent the complement and its visual appearance could reflect its selection status (see Figure 4.1). However, the InfoCrystal in its current form does not explicitly represent the complement and thereby shields users from a large class of queries that are usually of little benefit to them.
Unlike traditional Boolean methods, the InfoCrystal provides a partial ordering of the retrieved documents based on the degree of coordination between the search criteria, which is visualized by the rank layout. In particular, the Null Output and Output Overload problems are addressed by ranking the retrieved documents based on the number of criteria that are satisfied. Any document that satisfies all criteria will be in the top rank of the output; any which satisfies all but one will be in the second rank, and so forth. This ensures that there will be no null output as well as that the output is presented to users in a structured and partially ranked fashion so to avoid the overload problem. Many retrieval specialists believe that ranked output provided by the InfoCrystal will produce better results than the traditional Boolean approach [Cooper 1988].
4.2 Query Space Visualized by the InfoCrystal
For an InfoCrystal with N inputs there are ![]() queries that can be specified by
just selecting the appropriate interior icons. There are 2N - 1 interior icons.
Each can either be selected or so not, so each interior icon doubles the number
of possible queries. Existing visual query languages allow users to formulate
specific queries, but the InfoCrystal query language enables users to formulate
a whole range of related queries by creating a single InfoCrystal [Anick et al.
1991, Young and Shneiderman 1993]. For example, if there are five inputs then
there are over 2 billion possible queries and they are all represented
compactly by an InfoCrystal !
queries that can be specified by
just selecting the appropriate interior icons. There are 2N - 1 interior icons.
Each can either be selected or so not, so each interior icon doubles the number
of possible queries. Existing visual query languages allow users to formulate
specific queries, but the InfoCrystal query language enables users to formulate
a whole range of related queries by creating a single InfoCrystal [Anick et al.
1991, Young and Shneiderman 1993]. For example, if there are five inputs then
there are over 2 billion possible queries and they are all represented
compactly by an InfoCrystal !
4.2.1 Ways of Specifying a Boolean Query
The great number of queries that can be expressed by a single InfoCrystal
also illustrates the dilemma that such expressive power can pose for a user.
How to specify the appropriate selection pattern from this large universe of
possible queries ? We will provide next a summary of the multiple ways that
users can use to specify queries: First, they can select specific relationships
by clicking on the appropriate interior icons. Second, users can select subsets
of interior icons by clicking on the criterion icons, thereby performing
complex Boolean operations with only a few mouse clicks. Similar to a
calculator, they can use the InfoCrystal as a Boolean Calculator, where the
criterion icons represent the "numbers" or N different concepts to be
operated on and the interior icons represent the accumulator (see 4.2.2 for
discussion). Third, users can enter a specific Boolean query and there is a
facility that automatically activates the appropriate interior icons. Fourth,
users can select the interior icons by interacting with a threshold slider
and/or the weighting sliders for the inputs (as will be shown in the next
chapter).
4.2.2 InfoCrystal as a Boolean Calculator
Similar to a calculator, users can use the InfoCrystal as a Boolean Calculator, where the border icons represent the "numbers" or N different concepts to be operated on and the interior icons represent the accumulator, which can have 22N-1 distinct states. How can we represent the Boolean functions AND, OR and NOT ? In our current implementation we represent these functions by holding down certain keys while clicking on a border icon: Command key = OR, Option key = AND, Command+Control = OR NOT, Option+Control = AND NOT.

[e] ((((A and (not B)) or C) and D) or (not E))
Figure 4.2: [a], ..., [e] show the resulting selection pattern as users interact with the border icons in a step by step fashion to visualize the Boolean query ((((A and (not B)) or C) and D) or (not E)). The text describes the particular key combinations that need to be pressed while the user clicks on the border icons to perform the appropriate Boolean operations.
Figure 4.2 shows the resulting selection pattern as users interact with the border icons in a step by step fashion to visualize the Boolean query ((((A and (not B)) or C) and D) or (not E)). First, users would click on the white border icon representing A while they hold down the Command key to specify the Boolean statement (A). Second, they would click on the border icon representing B while they held down the Option+Control key combination to specify the Boolean statement (... and (not B)), where the resulting selection pattern of the interior icons represents the Boolean expression (A and (not B)). Users can continue in a similar fashion to specify the remaining parts of the above Boolean statement. There is also the possibility to include a toolbar with buttons representing the different Boolean operators that users could select before clicking on a border icon to perform the same operations described above. To summarize, a Boolean query has a selection patterns of the interior icons associated with each of its components that need to be integrated and consolidated based on the operators joining them. The AND is equivalent to an intersection operation; the OR is equivalent to an union operation; and the NOT is equivalent to taking the inverse or complement.
4.3 Creating Complex and Nested Queries
The InfoCrystals can be used as building blocks and organized in a hierarchical structure to create complex and nested Boolean queries. Figures 4.3 and 4.4 show how the InfoCrystals can be "chained together" to form a hierarchical query structure. Similar to a spreadsheet, users can ask "what-if" questions by changing which interior icons are selected in one InfoCrystal and observe how the contents of the dependent icons higher up in the hierarchy change dynamically. First, an InfoCrystal has several inputs, represented by the criterion icons, and has an output that is defined by the selected interior icons. Second, the output of an InfoCrystal will be one of the inputs to an InfoCrystal one level up in the query hierarchy. The leaf or atomic nodes of the InfoCrystal query structure represent the locations, where we interface with external information sources. The InfoCrystal is flexible in terms of the particular retrieval methods that are used to generate its input sets. Furthermore, it works for any data type. The items, which are retrieved based on the instructions specified in the leaf nodes, are then propagated through the query structure in a bottom-up fashion.
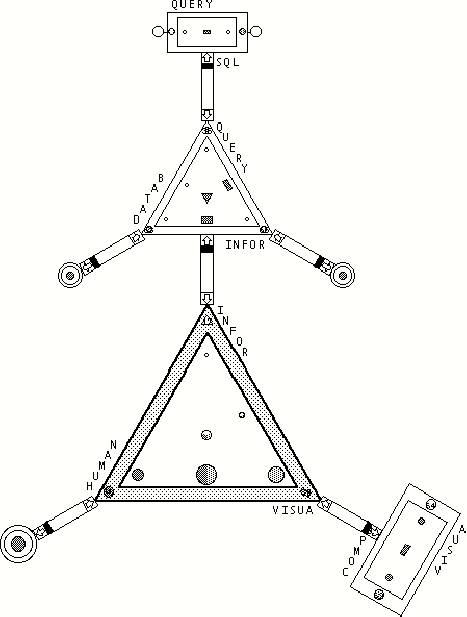
Figure 4.3: shows how the InfoCrystal tree structure shown in Figure 4.5 can be visualized by organizing the InfoCrystals in a hierarchical structure. The selected interior icons, displayed in solid black, define the output of an InfoCrystal. Users can see how the information distributes across the different relationships at the top level. In Figure 4.6 we show how this structure can also be represented by a text outline.
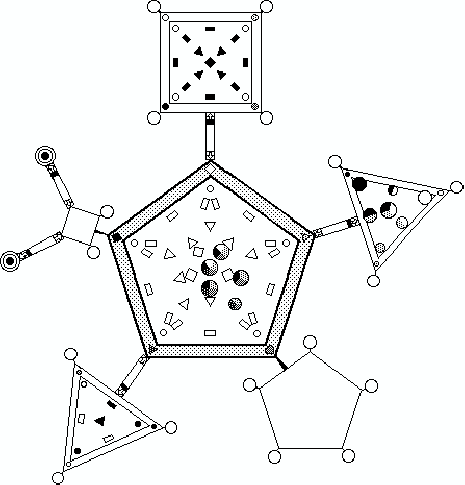
Figure 4.4: shows how another complex query can be represented by a series of InfoCrystals that are organized in a hierarchical structure. Some of the InfoCrystals are displayed only as an outline, but the user can just double-click them to view them in full detail. In the top-level InfoCrystal the selected icons are rendered, using a pie chart representation, to emphasize the quantitative information associated with them. Users can interactively change the way the InfoCrystals filter their inputs and they can dynamically observe how the information coming in through the circular InfoCrystals is propagated through the query structure.
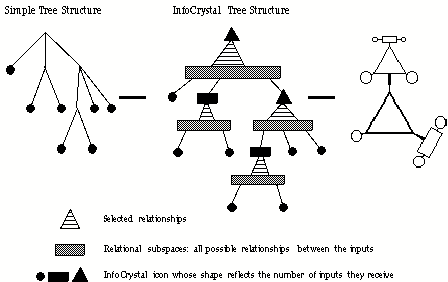
Figure 4.5: shows how an InfoCrystal tree structure differs from a simple tree structure. The figure on the very right shows the InfoCrystal tree structure visualized as a hierarchical InfoCrystal, where the individual crystals are shown as outlines. Figure 4.3 shows the same structure visualized in more detail.
Figure 4.5 illustrates the difference between a simple tree structure and an InfoCrystal tree structure. In the latter the parent nodes do not just inherit the data elements associated with their children nodes. Instead there is an intermediary step where all the relationships between the children nodes are represented in an InfoCrystal. Users have to decide which relationships should be included in the InfoCrystal's output that is passed on to the parent.
Of all the many queries that can be specified with an InfoCrystal, not all of them can be reduced or simplified to an algebraic Boolean form that is easy to grasp by the users. Further, users are not equally likely to formulate all the possible queries that involve N concepts. They tend to create Boolean queries that are not too long, that do not possess too many brackets or nesting levels, and that use in any query component only one of the Boolean operators.
This raises the following issue: To what extent will users be able to exploit the expressive power of the InfoCrystal, given the types of Boolean queries they have tended to formulate so far ? It can be argued that the above observation is a result of the difficulty users have in formulating Boolean queries using the current text-based and algebraic interfaces. An advantage of the InfoCrystal is that makes it possible for users to formulate any Boolean query by just clicking on the interior icons, without having to worry about specifying the operators and using parentheses correctly. However, as far as simplicity is concerned, there exists an inverse relationship between the Boolean and InfoCrystal query language for certain queries. For example, the Boolean query that is equal to the OR of all concepts requires the selection of all the interior icons, whereas the Boolean query that corresponds to a circular icon can require the use of all three Boolean operators AND, OR, NOT and the use of brackets. On the one hand, there are queries that are conceptually straightforward to express using the Boolean query language, but require the selection of a great number or a complex pattern of interior icons, which can be a demanding and time-consuming task. On the other hand, there are queries of the form, for example, "not more, exactly or at least M out of N concepts should be satisfied" that are easy to express in an InfoCrystal, but they are difficult to formulate as a Boolean query even for very experienced users. In chapter 8 we present the results of a user study that reflect this inverse relationship between the Boolean and InfoCrystal query languages.
By way of an analogy, we want to address the issue that certain simple or common Boolean queries require users to select a large subset of the interior icons. The larger the number of the interior icons to be selected, the greater the probability that users will fail to select all the necessary icons. Computer drawing programs provide users with a set of standard shapes such as an ellipse or a rectangle that they can use to get started and create more complex drawings. Similarly, we can provide users with a pull-down menu of standard Boolean queries that they can apply to an InfoCrystal. They can then modify the resulting selection pattern to arrive at a query that corresponds more closely to what they are looking for, but that would have been too difficult for them to formulate initially.
We also need to address the issue of how nested Boolean queries can be expressed in the InfoCrystal representation. We can use substitution to rewrite nested queries so that we have at each level and for each query component an equivalent and simple query that uses a single operator to join its components; i.e., (Green OR (Red AND Blue) OR (Red OR (Green AND Blue))) => (Green OR A OR B), where A=(Red AND Blue), B=(Red OR B'), where B'=(Green AND Blue). We have a choice how we want to represent a nested Boolean query in the form of an InfoCrystal. On the one hand, we could easily create a separate InfoCrystal for each of its simple components, and we could organize these crystals in a hierarchical structure. This has the advantage that the InfoCrystals are easy to program because their associated Boolean queries are simple and we can use one of the predefined Boolean queries from a pull-down menu. However, it has the disadvantage that we lose the flexibility we gain if we represent the overall query with a single crystal. On the other hand, we can represent the query in a single InfoCrystal. However, it may not be immediately apparent which of the interior icons need to be selected or which of the predefined Boolean queries should be selected from the pull-down menu to get us started, unless we could break the whole translation process into steps. There is a simple answer to this translation problem if we know how to formulate the Boolean query or it has somehow been given to us. For any Boolean query the InfoCrystal software provides the facility to automatically visualize it in a single InfoCrystal or in a series of simple InfoCrystals, depending on the user's preference. If, however, we want to determine ourselves which of the interior icons need to be selected, then we need help in addition to the predefined pull-down menu of simple and common Boolean queries.
At this point we have described a partial solution to the requirement that we want to be enable users to translate by themselves any nested Boolean queries into a single InfoCrystal in a series of steps, where each step only involves simple selection operations. The general solution hinges on our ability to propose a visually elegant way that enables users to save partial results and to access them at a later stage to combine them. We are faced with the same problem that we encounter when using a calculator to compute a complex numerical formula. If the formula can be rewritten in such a way that we can operate on the partial and intermediary results to arrive at the correct solution, then we do not need the facility to be able to save intermediary results. In such instances, we have described how the InfoCrystal can be used as a Boolean Calculator.
4.4 The Outliner Tool
Creating a simple or even a complex InfoCrystal query structure is as simple as generating an outline for a paper using the developed query outliner tool. Users can use it to incrementally structure complex searches by creating a hierarchical query outline (see Figure 4.6). The query outliner has a similar functionality to the familiar outlining tools available in word-processing packages. The outliner solves the problem of how users can easily annotate and summarize in a word or two what the nodes in a query hierarchy represent. Information retrieval scientists often suggest to searchers to generate a structured list of their search interest, where quasi-synonymous words for each conceptual factor are ORed and the different synonym lists are then ANDed [Cooper 1988, Marcus 1991]. The query outliner enables users to easily generate such structured lists.
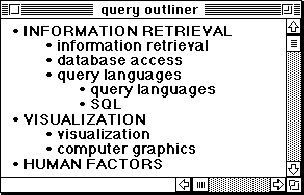
Figure 4.6: shows the outliner tool that users can use to generate an InfoCrystal query structure.
Users start to create a new outline item by pressing the return key, and they change the nesting level by pressing the tab or delete key. Users can use copy, cut and paste to modify the query outline. They can also select a part of the outline and move it to a different location in the query outline, where the InfoCrystal query structure is automatically updated to reflect this change. Hence, it is very easy for users to modify the query structure by interacting with the query outliner.
4.5 Narrowing and Broadening Techniques
In this section we will show how ways to broaden or narrow a Boolean could be visualized. For that purpose we repeat material already presented in section 2.3.1.2 to present the needed facts and steps in one place. A Boolean query can be described in terms of the following four operations: degree and type of coordination, proximity constraints, field specifications and degree of stemming as expressed in terms of word/string specifications. If users want to (re)formulate a Boolean query to retrieve documents then they need to make informed choices along these four dimensions to create a query that is sufficiently broad or narrow depending on their information needs. Most narrowing techniques lower recall as well as raise precision, and most broadening techniques lower precision as well as raise recall. Any query can be reformulated to achieve the desired precision or recall characteristics, but generally it is difficult to achieve both. Each of the four kinds of operations in the query formulation has particular operators, where for each operator with a narrowing effect, there is one or more inverse operators with a broadening effect [Marcus 1991].
If users want to (re)formulate a Boolean query, then they need to make informed choices along these four dimensions to create a query that reflects their information needs. This can be a daunting task, because the number of feasible choices grows exponentially as the number of concepts increases. Hence, users require help to gain an understanding of how changes along these four dimensions will affect the broadness or narrowness of a query.
Figure 4.7 shows how the four dimensions affect the broadness or narrowness of a query: 1) Coordination: the different Boolean operators AND, OR and NOT have the following effects when used to add a further concept to a query: a) the AND operator narrows a query; b) the OR broadens it; c) the effect of the NOT depends on whether it is combined with an AND or OR operator. Typically, in searching textual databases, the NOT is connected to the AND, in which case it has a narrowing effect like the AND operator. 2) Proximity: The closer together two terms have to appear in a document, the more narrow and precise the query. The most stringent proximity constraint requires the two terms to be adjacent. 3) Field level: current document records have fields associated with them, such as the "Title", "Index", "Abstract" or "Full-text" field: a) the more fields that are searched, the broader the query; b) the individual fields have varying degrees of precision associated with them, where the "title" field is the most specific and the "full-text" field is the most general. 4) Stemming: The shorter the prefix that is used in truncation-based searching, the broader the query. By reducing a term to its morphological stem and using it as a prefix, users can retrieve many terms that are conceptually related to the original term [Marcus 1991].
Figure 4.7 also indicates how the broadness or narrowness of a query could be visualized. Each of the four dimensions that characterize a Boolean query can be represented by a visual object: The larger the visual extent of an object, the broader the effect of the corresponding aspect of the query. Figure 4.8b shows how the stemming dimension can be represented by a gray rectangle, whose width reflects the degree of stemming applied. The resulting stem is used for a truncated search. Currently, we do not provide for a visual signature to represent an exact search, but this could be signaled by having a transparent stemming curtain. The different fields are also represented by rectangles and the more that are selected, the larger the overall gray area. Figure 4.8a shows how a proximity constraint can be represented by grouping the involved terms and stacking their visual analogs.
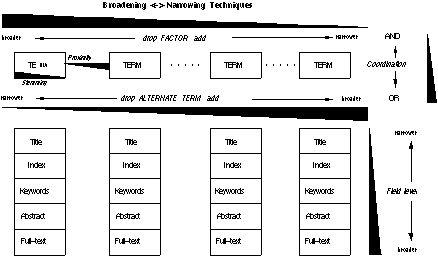
Figure 4.7: captures how coordination, proximity, field level and stemming affect the broadness or narrowness of a Boolean query. By moving in the direction in which the wedges are expanding the query is broadened.
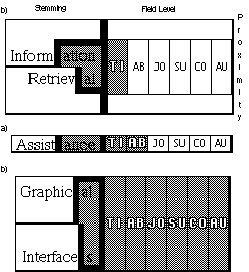
Figure 4.8: shows how the proximity, field level and stemming constraints for the information need "information retrieval assistance using graphical interfaces" can be visualized. a) Shows an example of how the degree of stemming and the field level are represented by their respective rectangles. The resulting stem corresponds to the part of the word not covered by the gray stemming rectangle. b) Shows different examples of the proximity constraint: the smaller the height of the rectangles, the closer together the terms have to be in a document.
The degree of proximity is represented by the height of the rectangles. Finally, we can modify the way the InfoCrystal visualizes Boolean coordination so that the resulting broadness or narrowness is reflected by an area-based visual measure. Instead of using icons, we could associate a visual area with each of the disjoint subsets (see Figure 4.10).
The guiding visual metaphor is simple and intuitive: The broadness of a query is represented by the size of its visual analogs (the larger the visual area, the broader the query). Hence, the query characteristics in terms of coordination, proximity, field level and stemming and how they affect the broadness of the query can be made visually explicit and transparent. The visual representation can be thought of in several analogous ways:
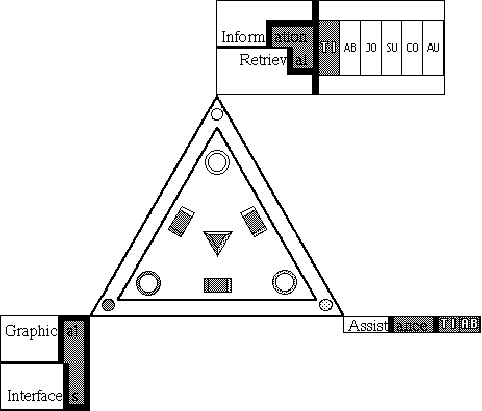
Figure 4.9: shows how the visual objects representing the stemming, field and proximity constraints can be integrated with the part of the InfoCrystal that visualizes Boolean coordination to represent the information need "information retrieval assistance using graphical interfaces". This interface gives users a quick insight into the constructed query. Users can change the amount of information retrieved by changing the size of the gray area of the objects that represent the different aspects of a Boolean query. The larger the shaded areas, the more information is retrieved.
1) The Sieve analogy: each of the four dimensions can be thought of as controlling a gate through which information can flow. 2) The Window analogy: each of the four dimensions can be thought of as a window through which information becomes visible. 3) The Optical Lens analogy: each of the four dimensions can be thought of as a lens through which information can pass and users can manipulate the degree to which they want to focus the stream of information.
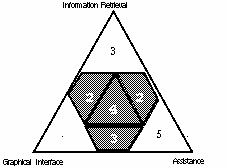
Figure 4.10: shows how we could visualize Boolean coordination using an area-based measure. The numbers represent the number of documents that are associated with the different relationships visualized by the InfoCrystal.
Once users have understood one of these simple analogies, it will be easy for them to modify or fine-tune their query depending on their information needs. They simply have to think of it in terms of manipulating the coarseness / fineness of the visual representation: For example, by enlarging the gates through which information can flow, they are increasing the information that becomes available. If users are dealing with a nested query, then they have a hierarchy of gates through which they can control the flow of information. At the lowest level users could use the "stemming", "field level" and "proximity" gates to control the flow of information, whereas higher-up they will use the "coordination" gates to broaden or focus the information.
To summarize, we have demonstrated how the InfoCrystal can be used to formulate and visualize arbitrarily complex Boolean queries. In addition, we have presented special visual tools for modern Boolean text retrieval.