5 Visualizing Weighted Queries ................ 77
- 5.1 Introduction ................ 77
- 5.2 Formulating Weighted Queries using the InfoCrystal ................ 78
- 5.3 The Bull's-Eye Layout ................ 82
- 5.4 The Expressive Limits of Weighted Queries ................ 85
- 5.5 Possible Alternative for Specifying Weighted Queries ................ 87
- 5.6 Discussion ................ 88
The postscript version of this chapter.
Chapter 5
Visualizing Weighted Queries
5.1 Introduction
One of the complaints about Boolean structured retrieval is that it does not ordinarily provide users with a ranked output of the retrieved documents. We have shown in a previous chapter that the InfoCrystal provides a partial ordering of the retrieved documents based on the degree of coordination between the search criteria. We want to show in this chapter how the InfoCrystal representation can be extended to formulate and visualize weighted queries.
It is desirable to be able to formulate weighted queries for several reasons. First, there are situations where the search criteria are not of equal importance to a user, and we want to use this information to rank the retrieved documents accordingly. Second, users can find it initially easier to formulate queries by creating just a list of their interest and assigning relevance weights to them [Frei and Qiu 1993]. These weights can be used by a retrieval system to generate a Boolean query. However, the question arises of how to exactly to use these weights to create a Boolean query. We will show how the InfoCrystal can be used to translate weighted queries into Boolean queries. The InfoCrystal has the added advantage that it enables users to see and control in a visual way how the translation is performed. Further, we will show how the interior icons can be displayed in a ranked way that reflects the weights of the search criteria by developing the bull's-eye layout. Finally, we discuss and show why weighted queries do not have an expressive power equivalent to the Boolean query language does. We also address why the interior points of an InfoCrystal can not be used to specify every possible direction of a vector of weights.
5.2 Formulating Weighted Queries using the InfoCrystal
There are two ways of extending the InfoCrystal representation to be able to formulate weighted queries. First, users can assign weights to the concepts listed in the query outliner window by entering weights, enclosed by square brackets, after each outline item. Second, we can associate a slider with each input criterion of an InfoCrystal, and users can interact with the weight sliders to specify the degree of importance they assign to the inputs (see Figure 5.1, which shows only the sliders for the criteria whose weights are not equal to the default weight of plus one). Users can choose values between -1 and 1, where negative weights indicate that users are more interested in documents that do not contain the concept represented by the input (i.e., the weight -1 is equivalent to the logical NOT). There is also the possibility that the initial values of the weights are computed automatically based on the statistical term frequencies of the search terms in a document collection.
The assigned weights can be used to compute a relevance score for each interior icon. This score is equal to the normalized dot product between the vector of the input weights and a vector, whose values are equal to 1 or -1 depending on whether the corresponding search criteria are satisfied or not by the interior icon. By interacting with a threshold slider, users can select only those interior icons whose relevance score is above the threshold (see Figures 5.1 and 5.2).
The example shown in Figure 5.1 will help to explain how the relevance score is computed: First, we have assigned the weights 1, -1, 1, 1, and -1 to the search criteria A, B, C, D, and E respectively (only the sliders for the criteria whose weights are not equal to the default weight of plus one are shown). Hence, the vector of the input weights is equal to [1,-1,1,1,-1]. Second, we can define a vector for each of the interior icons, whose values are equal to 1 or -1 depending on whether the corresponding search criteria are satisfied or not by the icon. For example, the vector for the pentagon icon in the center of the InfoCrystal is equal to [1,1,1,1,1], because it satisfies all of the five search criteria. Hence, if we take the vector product of the weight vector and the vector associated with the pentagon, then we get a relevance score of {(1w 1) + (-1w 1) + (1w 1) + (1w 1) + (-1w 1)} = 1. If we normalize this score, then we get a value of 1/5, because the maximal score is equal to 5.
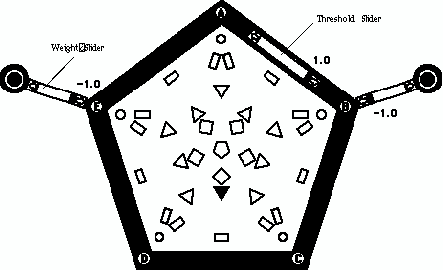
Figure 5.1: shows how the InfoCrystal can be used to formulate weighted queries by associating sliders with each of the input criteria (only the sliders whose weights are not equal to the default weight of plus one are shown). Users can set a threshold to approximate the weighted query by a Boolean query, where the weights are used to compute a normalized relevance score for each of the interior icons (see text). If the threshold is set equal to 1.0 and relevance weights for the search criteria A, B, C, D, and E are equal to 1.0, -1.0, 1.0, 1.0, and -1.0, respectively, then only the triangular icon, representing (A and (not B) and C and D and (not E)), is selected and therefore displayed in black.
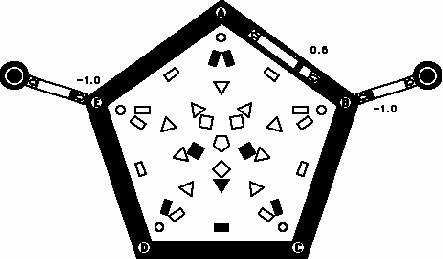
Figure 5.2: shows which of the interior icons are selected when the threshold is lowered to 0.6 and the relevance weights remain the same as in Figure 5.1.
Actually, this normalized score is equal to the cosine of the angle between the two vectors. To consider a further example, the shaded interior icon in the shape of a triangle has the vector [1,-1,1,1,-1], because it satisfies A, C, and D, but not B and not E. Hence, its relevance score is equal to {(1w 1) + (-1w -1) + (1w 1) + (1w 1) + (-1w -1)} = 5, and its normalized score is equal to 1. In a similar fashion, we can compute the relevance scores for the other interior icons, and we can determine their selection status based on which of the normalized scores are above the current threshold. Figure 5.1 shows that only the shaded triangular icon is selected if the threshold is equal to its maximal value of 1.0. If we lower the threshold to 0.6, then Figure 5.2 shows the interior icons that have a relevance score equal or above this threshold.
The InfoCrystal makes it possible for users to specify a set of weighted search criteria and to approximate this weighted query as a Boolean query by setting a threshold that controls the exactness of the approximation. If they choose the maximal threshold of 1.0, then they require the approximation to be exact. However, there does not always exist a Boolean approximation for every weighted query if users require the threshold to be maximal. By lowering the threshold, they indicate how closely they want to approximate the weighted query by a Boolean query. If users choose the minimum threshold value of minus one, then they approximate the weighted query by a Boolean query that coordinates the search criteria with the OR operator. This is the broadest possible query and it will have a high recall and very low precision value.
We can think of the vector of weights as specifying a direction in a multi-dimensional information space in whose vicinity we want to explore the space. As we will discuss in the next chapter, this weight vector is equivalent to the query vector used in vector-space retrieval approaches to specify the user's information need. The vector-space approach represents the information items and the query as vectors, and it commonly uses the angle between the information item vectors and the query vector to determine their similarity. The threshold slider, which is used to control the degree of Boolean approximation, uses the same angular measure. As we will show, the InfoCrystal component that permits the formulation of weighted query just represents a special case of the more general vector-space retrieval approach. In both cases we need to decide how similar we require the retrieved information to be to the specified weight or query vector. The difference between weighted query and vector-space approaches is that they operate on different basic groupings of information. On the one hand, the weighted query approach operates on the different possible relationships between the search criteria, where each relationship represents a collection of information items. On the other hand, the vector-space approach operates on the individual information items. Hence, the weighted query approach operates on sets of information items, where the membership is determined based on Boolean logic.
It is also relevant to briefly mention that the human visual system processes information at different levels of resolution and employs different grouping principles to arrive at higher-level perceptions [Marr 1982]. Similarly, we can think of the Boolean partitioning of an information space as a way to create higher-level constructs. This type of grouping will not always be the most appropriate one to perform or it will need to be replaced by other ways of organizing the information. Hence, the different retrieval approaches provide us with different ways of organizing information. Each of them has different expressive powers and is better suited for different tasks. As we hope to demonstrate in this thesis, the InfoCrystal offers a visual framework where users can explore and with little effort shift between different ways of retrieving and organizing large information spaces.
To summarize, one of the advantages of the InfoCrystal is that enables users to see and control in a visual way how a weighted query is translated into and approximated by a Boolean query. Further, users can easily employ a hybrid approach, where they use the weight and threshold sliders to get started and they can then proceed to select or deselect individual interior icons to arrive at a query that captures their information need more precisely. If the selection pattern of the interior icons is not consistent with the relevance weights and the threshold, then the threshold indicator is dimmed and not displayed in solid black.
5.3 The Bull's-Eye Layout
By assigning weights to the query concepts, users can rank the interior icons and thereby impose a partial ordering on the retrieved documents, where documents associated with the same interior icon receive the same score. The key design principle used in the layout of the interior icons of an InfoCrystal is to ensure that users will find towards its center the relationships that they consider as more important. So far we have considered the rank layout that ensures that the number of criteria satisfied by an icon increases as we move towards the center of an InfoCrystal. We will now describe how users can display the interior icons to reflect their ranking based on the current setting of the relevance weights. This mapping, called the bull's-eye layout, causes the relationships with a higher relevance score to be placed closer towards the center of the InfoCrystal (see Figure 5.3).
We use the following polar representation to determine the placement of the interior icons in the bull's-eye layout: 1) The radius value is determined by the inverse of the relevance score, which is equal to the cosine of the angle between the weight vector and the vector that we can define for each interior icon. 2) The angle, however, is not affected by the weights. It is a function of the line that passes through the InfoCrystal's center and the center of mass of the criterion icons that is computed as follows: a two-dimensional vector pointing from the center towards a criterion icon that is satisfied by an interior icon receives a positive mass of one, whereas the vector pointing towards a criterion that is not satisfied receives a negative mass of minus one. We take these vectors and their associated point masses to compute their center of mass (see Figure 5.4). Thus, this center of mass will be closer to those criterion icons that the interior icon satisfies than to those it does not. Finally, we place the interior icon where the line defined by the center of mass intersects the circle defined by the relevance score (see Figure 5.5).
There are degenerate cases, where the center of mass of an interior icon coincides with the center of the InfoCrystal, and therefore we can not specify the angle and its corresponding straight line. In these cases we place the interior icon where the line, which passes through the first criterion icon satisfied by the icon, intersects the circle (we have an implicit ordering of the input or criterion icons, which in the figures is made explicit by using the letters A, B, C, 0 to label them).
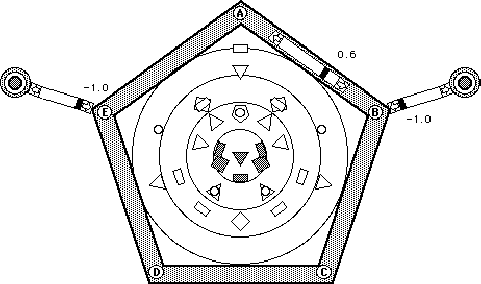
Figure 5.3: shows the bull's-eye layout of the interior icons, where they are placed in such a way that their relevance score increases as we move towards the center. This mapping visualizes the resulting ranking of the interior icons based on the current setting of the weights assigned to the search criteria, which in this case is 1, -1, 1, 1, and -1.
![]()
Figure 5.4: shows how to compute the center of mass for the interior icon of rank four that satisfies the criteria B, C, D, and E, but not A. The two-dimensional vectors pointing from the InfoCrystal's center towards the criterion icons B, C, D and E have a mass of plus one assigned to them and are therefore displayed in solid black. However, the vector pointing towards the criterion icon A receives a mass of minus one and is displayed in gray. If the vectors are scaled according to the masses associated with them then (b) shows the resulting vectors. The solid circle shows the location of the center of mass if the weighted average of the vectors is taken.
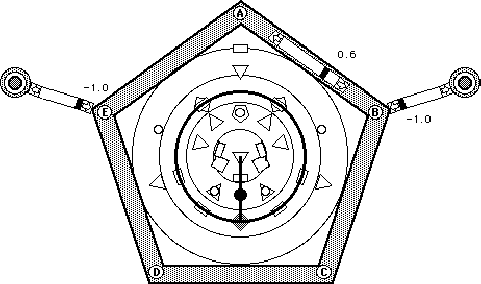
Figure 5.5: illustrates how the position of the icon of rank four, shown as a shaded square, is computed in the bull's-eye layout by using the following polar representation: 1) The radius value is determined by the inverse of the relevance score of the icon and it defines a circle on which it has to lie. 2) The angle is specified as follows: the center of mass of the shaded icon of rank four is shown as a solid circle and we define a line passing through it and the center of the InfoCrystal. We place the shaded square icon at the location where this straight line intersects the circle defined by the relevance score.
As Figure 5.3 shows, different interior icons can coincide and be mapped to the same location in the bull's-eye layout. Hence, a particular location in the bull's-eye does not have a unique interpretation in terms of how it is exactly related to the different search criteria. If we display the shape and color information associated with an icon, then we can tell more readily what the relationship is, but location information alone is not sufficient. This should come as no surprise, because information will be lost when we map a point in a n-dimensional space into a point in a two-dimensional display.
What is the relationship between the bull's-eye and the rank layout? The rank layout is a special instance of the bull's-eye layout, where all the input weights have the same value. However, there are following important differences between these two related layouts: 1) The rank layout algorithm will place the interior icons in different locations, whereas bull's-eye layout can map different interior icons to the same location. 2) The rank layout treats the icons of rank two, which are related to non-adjacent criterion icons, in a special way and duplicates them to ensure that they are as close as possible to their related criterion icons as well as at the correct distance from the center. 3) The radius of the circle on which an icon has to be placed is determined in a slightly different fashion in the rank layout than in the bull's-eye layout (see section 3.4).
The goal of information visualization is to transform large, multi-dimensional data sets or information spaces into a visual abstraction that makes explicit the type of relationships users are interested in exploring. In the current context we want to visualize the ranking of the retrieved information based on the weights that have been assigned to the search criteria. The common way to display this type of information is to use a ranked list, which, by the way, we can use in parallel to the InfoCrystal (see Figure 7.3). The problem with a ranked list is that it provides us with a limited point of view, because it confounds and obscures how the retrieved documents are exactly related to the stated interests [Spoerri 1993, Hearst 1994]. The ranked list does not suggest how the space could be explored in other ways or how users could successfully modify a query if the need arises. The InfoCrystal in bull's-eye layout mode not only provides the information contained in a ranked list, but it has the attractive feature that it also provides users with a qualitative sense of how the ranked documents are related to the input criteria.
5.4 The Expressive Limits of Weighted Queries
The question arises to what extent the interior icons of the InfoCrystal and the slider interface are equivalent in terms of their expressive power. The former lets users formulate queries by interacting with the interior icons directly. The latter lets users formulate queries by choosing weights and applying a threshold. This question is worth asking because if these two representations are equivalent, then we only need to support the one that is easier for users to use. The slider interface has an intuitive appeal, but it can be proven that only 2N*N of the 22N possible Boolean queries can be generated by assigning weights and applying at threshold. This result follows from the analysis of Linear Threshold Networks or Boolean Perceptrons [Anthony and Biggs 1992].
For example, it is not possible to represent the Boolean query ((A or B) and
(C or D)) by applying a threshold to the linear sums of the weights. Figure 5.6
shows the interior icons that need to be selected to specify this query (where
the rank layout is used because the exact weights can not be inferred). In
particular, Figure 5.6 shows that not all of the icons of rank two should be
selected. Hence, our proof focuses on two of the four interior icons of rank
two that should be selected and on the two interior icons that should not be
selected. Two of the relationships of rank two that need to be selected and
hence whose relevance scores need to be equal or above the threshold T produce
the following constraints, where a, b, c and d represent the weights assigned
to the criteria A, B, C, and D, respectively: (a + d) - (b + c) >= T
[1] and -(a + d) + (b + c) >= T [2]. Equations [1] and [2] imply that
T<= (a + d) - (b + c) <= -T [3], which in turn implies that T<=
0 [4]. The two relationships of rank two that should not be selected and
hence whose relevance scores need to be below the threshold T produce the
following constraints: (a + b) - (c + d) < T [5] and -(a + b) + (c
+ d) < T [6]. Equations [5] and [6] imply that -T< (a + b) - (c +
d) < T [7], which in turn implies that T> 0 [8], causing a
contradiction with equation 4 that requires T to be non-positive. Hence, the
type of selection pattern that corresponds to the Boolean query ((A or B) and
(C or D)) can not be created by assigning weights to the inputs and applying a
threshold.
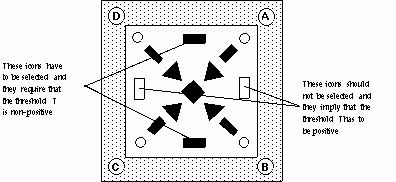
Figure 5.6: shows the interior icons that need to be selected to specify the Boolean query ((A or B) and (C or D)). In particular, it shows that not all of the icons of rank two should be selected. However, this type of selection pattern can not be created by assigning weights to the inputs and applying a threshold. The icons of rank of rank two, which need to be selected, imply that the threshold should be non-positive, whereas the two icons of rank two, which should not be selected, require that the threshold be positive. Hence, we have contradictory requirements.
5.5 Possible Alternative for Specifying Weighted Queries
Instead of having to specify the relevance weights by interacting with the weight sliders, would it be possible that users could point within the interior of the InfoCrystal to express their preferences in a qualitative way ? The InfoCrystal uses location as an organizing principle: users can expect the retrieved information to be related in specific ways to their interests based on the specific location they select in the interior of the InfoCrystal. However, the InfoCrystal emphasizes binary relationships rather than on continuous ones. Users initially interpret the interior icons by using the relative distances to the criterion icons as a major visual cue. Would it be possible to make use of this initial tendency of users ? We are asking if we could extend the location principle to enable users to infer degrees of relatedness instead of just binary relationships.
We will now show that the interior points of an InfoCrystal do not possess the expressive power to represent all the possible vectors of relevance weights, even if we restrict ourselves to just being able to specify the directions of these vectors. Let us suppose that we would like to specify all the possible directions in the subspace of a n-dimensional space, where all the coordinates are positive. It is sufficient to just consider the direction and to ignore the magnitude of the vector, since we use the angle between the vector of relevance weights and the vector representing an information item to determine similarity.
How could we infer a direction of a n-dimensional vector from a point chosen in the interior of an InfoCrystal ? First, we can measure the distances between this point and the N criterion icons. Second, we can take the inverse of these distance measures to achieve the effect that the degree of relatedness decreases as the distance increases. Third, the N-1 ratios between these N distance measures allow us to define a unique direction in the positive n-dimensional subspace. The question is now: Can we generate all the possible positive directions in this manner? The answer is no ! There are several possible proofs. The short explanation consists of pointing out that the fixed configuration of the criterion icons and the interior point that can be chosen freely as long as it stays within the interior of the InfoCrystal do not possess the necessary number of N-1 degrees of freedom. If we specify the exact location of the interior point so that the ratio of the distances between it and the criterion icons i and j has a desired value, then all the other ratios are also specified. The only way we could change this is to ask users to change the location of the criterion icons, but then we are back to the slider scenario, where we have to change more than one variable to specify a weighted query.
5.6 Discussion
We have pointed out that we only use the locations where the interior icons are placed in the rank layout to communicate meaning. The other areas are not endowed with meaning, although the human visual system has a tendency to give it meaning. Hence, the possible information density is not fully exploited [Tufte 1983 and 1990]. Why do we not make use of this unused space and increase the information density ? There are at least two ways to answer this question.
First, we make use of the whole space in the bull's-eye layout and all the different points within the concentric circles represent different relevance scores and provide some indication of how the different search criteria have contributed to the scores. However, we pointed out that different interior icons can be mapped to the same point in the bull's-eye layout. Therefore, it is not possible to infer in a unique fashion from a point in bull's-eye layout how it is exactly related to interior icons. The bull's-eye layout uses a many-to-one mapping.
Second, we are interested in developing a visual abstraction that leads to an one-to-one mapping, because such a mapping not only has descriptive power, since it enables us to see large amounts of information in a compact way, but that also has expressive power that enables us, for example, to interact with the data to issue commands. In order to achieve this goal, we need to group the information. The finite number of discrete relationships among N search concepts represents one way of organizing a large and multi-dimensional information space, and it achieves our goal to arrive at a one-to-one mapping. It enables us to use the InfoCrystal as a visualization tool as well as a visual query language. This versatility and expressiveness comes at a price, because we have to sacrifice information density. Hence, there is a trade-off between the information density we can achieve and the expressive power of the resulting visualization.