6 Visualizing Vector Space Queries ................ 89
- 6.1 Introduction ................ 89
- 6.2 Visualizing Any Ranking Function ................ 91
- 6.3 The Continuous Bull's-Eye Mapping ................ 96
- 6.4 Discussion ................ 99
The postscript version of this chapter.
Chapter 6
Visualizing Vector Space Queries
6.1 Introduction
How is it possible to integrate and visualize the competing, but complementary Boolean and Partial Matching approaches in the same visual framework to enable users to make effective use of their respective strengths? The InfoCrystal can be generalized to formulate and visualize vector-space queries. The vector-space approach computes the relevance score from the weights assigned to the index terms that represent the query and the document, respectively [Salton 1983]. These weights reflect how well the index terms describe the content of a document and a query, respectively. In chapter 5, we have demonstrated how the InfoCrystal can be used to formulate and visualize weighted queries. We also introduced the bull's-eye layout that uses the centers of mass of the interior icons to compute their locations. We can generalize the way the center of mass is computed so that we can consider vector space queries: the components of a document vector can now have values between -1 and 1 to reflect the degree to which they do (not) describe the document's content. The two-dimensional vector, which points from the InfoCrystal's center in the direction of a criterion icon, is now scaled by the degree to which the document's content does (not) satisfy the criterion (see Figure 6.1).
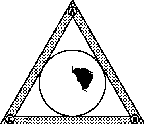
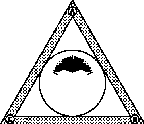
Figures 6.2 and 6.3 show how the discrete version of the InfoCrystal is related to the continuous one that can visualize vector space queries. Figure 6.2 shows that the document vectors, whose components are positive with respect to criteria A and B, but negative for C, cluster in the vicinity of interior icon that represents the relationship (A and B and (not C)). Similarly, Figure 6.3 shows that the document vectors, whose components are positive with respect to criterion A, but negative for B and C, cluster in the vicinity of interior icon that represents the relationship (A and (not B) and (not C)).
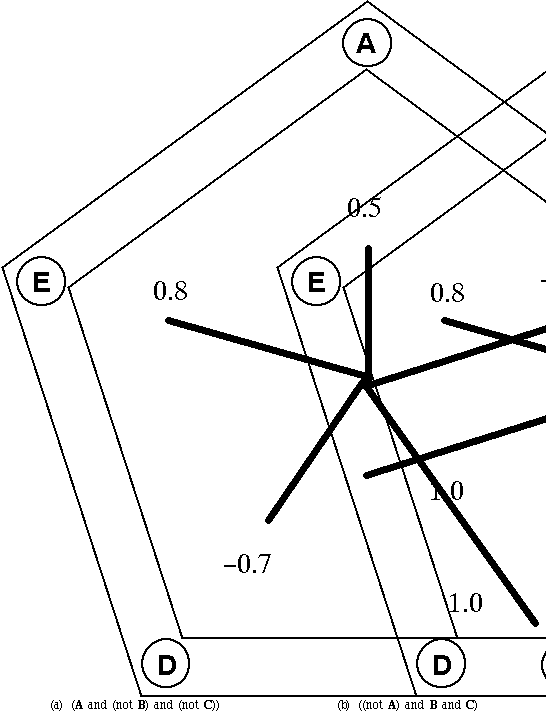
Figure 6.1: shows how to compute the center of mass for a document vector equal to (0.5, -1.0, 1.0, -0.7, 0.8). (a) The two-dimensional vectors pointing from the InfoCrystal's center towards the criterion icons are scaled based on the corresponding components of the document vector. If the vectors are scaled according to the masses associated with them then (b) shows the resulting vectors. The solid circle shows the location of the center of mass if the weighted average of the vectors is taken.
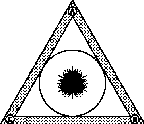
We can think of the discrete case as the limit of the continuous case. The documents, which satisfy the same criteria and are therefore represented by the same interior icon in the discrete mode, will cluster in an orderly fashion in the continuous mode (see Figures 6.5 and 6.7). The difference between the continuous and the discrete versions of the InfoCrystal is that in the former the dots displayed in its interior represent individual documents, whereas in the latter the interior icons represent how a collection of documents is related to the criterion icons. The continuous version of the InfoCrystal allows users to visualize an information space at the level of the individual documents based on their ranked relevance scores. Documents with high relevance scores are displayed closer to the center of an InfoCrystal. Documents with low relevance scores are displayed further away from the center, where the ones with lowest possible score lie on the outermost circle shown in the interior of an InfoCrystal (see Figure 6.4). The polar transform used in the bull's-eye layout to map the documents has the attractive feature that it not only visualizes the ranking of the relevance scores, but it also provides users with a qualitative sense of how the documents are related to the input criteria. Figure 6.4 shows the resulting distribution pattern of the relevance scores if we uniformly sample all the document vectors that lie in the cube {[-1, 1]; [-1, 1]; [-1, 1]}. In section 6.3 we analyze in more detail why we get the type of distribution patterns that we can observe in Figures 6.4, 6.6, 6.8 and 6.9. Figures 6.5 (a) to (c) show that documents that are related in a specific way to the search criteria will cluster in the locations where we would expect them to do so. Hence, the proximity or location principle is preserved by the polar transform. In Figure 6.6, for example, the input weights are equal to (1,1, -1), and as expected the documents with the lowest score are displayed close to the criterion icon A for the following reasons: 1) The documents that satisfy the criterion A but not the criteria B and C will receive the lowest score. Hence, these documents should be displayed the furthest away from the center. 2) On the basis of the proximity principle, we expect documents that only satisfy A to be displayed closer to the criterion icon representing A and further away from the other two criterion icons.
6.2 Visualizing Any Ranking Function
The InfoCrystal is flexible in terms how the relevance score and therefore the radius value is calculated. Hence, we can use, for example, the probability estimates of the document's relevance or the distance-based p-norm to rank the documents [Fox 1983, Belkin and Croft 1992]. We could also use the degree to which a document satisfies the query in terms of coordination, proximity, field level and stemming to rank the retrieved documents [Marcus 1991]. Further, we can decouple the computation of the relevance score from the specified interests and actually use many more criteria than ones that are made explicit in an InfoCrystal. The computation of the center of mass can remain linked to the specified criteria. In short, the InfoCrystal can be used to visualize any ranked list or fuzzy set, where the way the items relate to the specified reference or search criteria is used to compute the center of mass.
The InfoCrystal representation also opens up the possibility that users can visually specify (several) arbitrarily shaped areas, where the documents contained within them would define the output of the InfoCrystal. This way of selecting a subset from a ranked list would be impossible to perform by pruning a ranked linear list by setting multiple thresholds.
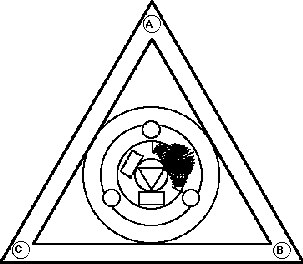
Figure 6.2: shows the relationship between the discrete and continuous version of the InfoCrystal, where the document vectors, whose components are positive with respect to criteria A and B, but negative for C, cluster in the vicinity of interior icon that represents the relationship (A and B and (not C)). The interior icons are displayed using the bull's-eye layout, where the weights assigned to the criteria are (1,1,1).
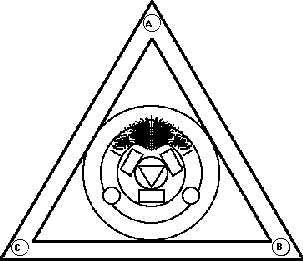
Figure 6.3: shows that the document vectors, whose components are positive with respect to criterion A, but negative for B and C, cluster in the vicinity of interior icon that represents the relationship (A and (not B) and (not C)). The weights assigned to the criteria are (1,1,1).
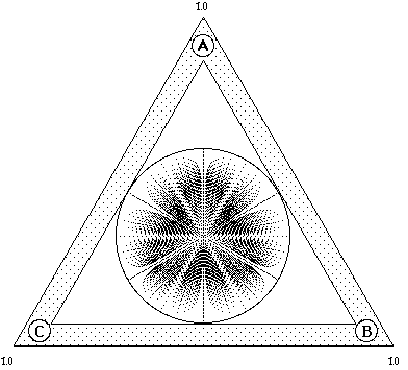
Figure 6.4: shows the distribution pattern of the relevance scores of a uniform sampling of all the document vectors that lie in the cube {[-1, 1]; [-1, 1]; [-1, 1]}, where we use the bull's-eye layout principle that reflects the values of the criteria weights, which are equal to (1.0,1.0,1.0). The black points within the circle represent individual documents.
[a] (A and B and C) [b] (A and B and (not C)) [c] (A and (not B) and (not C))
Figure 6.5: If the weights associated with the search criteria A, B and C are all equal to one, then (a) shows that the documents that are related to A, B and C in a positive way will cluster in the center of the InfoCrystal, which is where we would expect to find them; (b) displays where the documents that are related in a positive to A and B and in a negative way to C will cluster. (c) shows where the documents that are related in a positive way to A and in a negative way to B or C will be located.
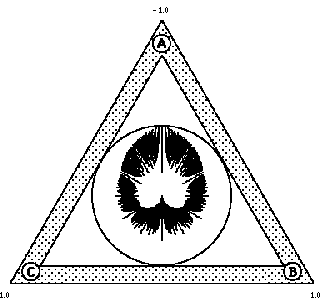
Figure 6.6: shows the distribution pattern of the relevance scores of a uniform sampling of all the document vectors that lie in the cube {[-1, 1]; [-1, 1]; [-1, 1]}, using the bull's-eye layout principle that takes into account the values of the criteria weights, which are equal to (-1.0,1.0,1.0).
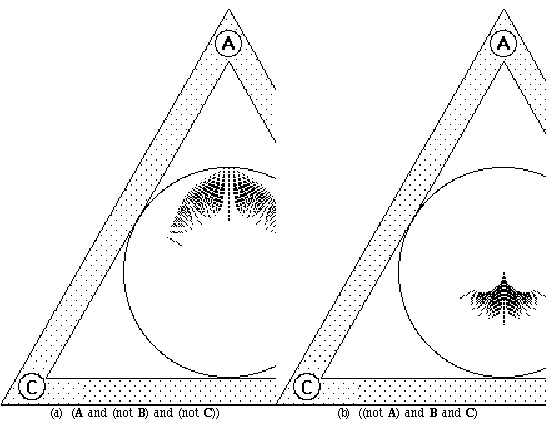
Figure 6.7: If the weights associated with the search criteria A, B and C are equal to -1, 1 and 1, respectively, then (a) shows that the documents that are related to A, but not B or C, will cluster close to A, which is where we would expect to find them; (b) displays where the documents that are related to B and C in a positive way and to A in negative will cluster in and close to the center, but away from A, which is again where we would expect them to be located.
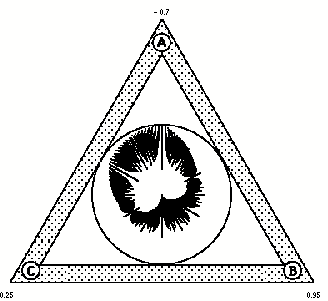
Figure 6.8: shows the distribution pattern of the relevance scores of a uniform sampling of all the document vectors, where the values of the criteria weights are equal to (-0.7,0.95,0.25).
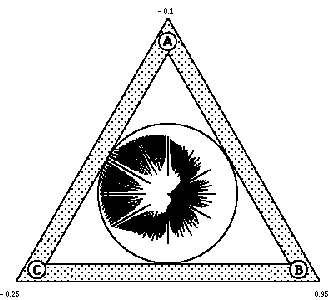
Figure 6.9: shows the distribution pattern of the relevance scores of a uniform sampling of all the document vectors, where the values of the criteria weights are equal to (-0.1,0.95,-0.25).
6.3 The Continuous Bull's-Eye Mapping
In this section we discuss in detail how we compute the continuous version of the bull's-eye layout. Further, we will analyze why we get the types of distribution patterns that we can observe in Figures 6.4 to 6.9 when we map a n-dimensional vector space representation into a two-dimensional InfoCrystal with n concepts.
To remind the reader, a document is represented by a n-dimensional vector, whose components can take values between -1 and 1 inclusive. A negative value of -1 implies that a concept is not at all present in the document, whereas a positive value indicates that the concept is present to a degree proportional to the component value. The query is also represented by a n-dimensional vector, whose components can take values between -1 and 1 inclusive. A negative value implies that we are not interested in the corresponding concept and a positive one that we are interested to a degree proportional the weight.
The bull's-eye mapping uses a two-dimensional polar transform where the
radius and the angle are defined as follows: 1) The radius is equal to the
relevance score, which is computed by taking the cosine of the angle between a
document vector ![]() and the weight vector
and the weight vector ![]() . 2) The angle is
defined by the line that passes through the InfoCrystal's center and the center
of mass of the criterion icons. The center of mass is computed as follows: the
two-dimensional vectors pointing from the InfoCrystal center towards the
criterion icons are scaled based on the corresponding components of the
document vector (see Figure 6.1). The center of mass is equal to the weighted
average of these scaled vectors. Thus, the center of mass and therefore the
document will be closer to those criterion icons that they are related to in a
positive way than to those criterion icons for which this is not the case.
Further, the angle is not affected by the weights. There are document vectors
whose center of mass will coincide with the center of the InfoCrystal and
therefore the angle can not be specified. In these cases, we place the document
where the line, which passes through the first criterion icon that is satisfied
to some degree by the document, intersects the circle defined by the relevance
score .
. 2) The angle is
defined by the line that passes through the InfoCrystal's center and the center
of mass of the criterion icons. The center of mass is computed as follows: the
two-dimensional vectors pointing from the InfoCrystal center towards the
criterion icons are scaled based on the corresponding components of the
document vector (see Figure 6.1). The center of mass is equal to the weighted
average of these scaled vectors. Thus, the center of mass and therefore the
document will be closer to those criterion icons that they are related to in a
positive way than to those criterion icons for which this is not the case.
Further, the angle is not affected by the weights. There are document vectors
whose center of mass will coincide with the center of the InfoCrystal and
therefore the angle can not be specified. In these cases, we place the document
where the line, which passes through the first criterion icon that is satisfied
to some degree by the document, intersects the circle defined by the relevance
score .
To provide the reader with a better insight into the distribution pattern that result when we map a document space into an InfoCrystal, we want to characterize the geometrical surfaces that are defined by documents with a specific relevance value or whose center of mass lies along a particular line (which is equivalent to saying that they have a particular angle). We show below that a particular relevance score defines a cone and that the angle specified by the center of mass defines a plane passing through the origin. We begin with the surface defined by a relevance score:
r = relevance-score = ![]()
which defines a cone with angle a in the direction of ![]() and its apex
is at the origin. In order to show that documents, whose centers of mass lie on
a particular line in the InfoCrystal with n inputs, define a plane, we
need to examine how we compute the center of mass
and its apex
is at the origin. In order to show that documents, whose centers of mass lie on
a particular line in the InfoCrystal with n inputs, define a plane, we
need to examine how we compute the center of mass
![]() :
:
center of mass for ![]() =
= ![]()
if n = 3 then
= ![]()
This center of mass can be used to define a straight line that passes through the origin and that has an angle equal to a.
If we want to select only documents whose centers of mass lie on a straight line that passes through the origin and that has an angle equal to a then we get the following constraint:
k = tan a = ![]()
We can rewrite this equation to arrive at the following equation:
0 = ![]()
which defines a plane that passes through the origin and its normal is equal to:
normal to plane = ![]()
To summarize, documents that have a specific relevance value lie on a cone, whose angle is equal to arc cosine of the relevance value and whose apex is at the origin. Documents whose center of mass lie along a particular line lie on a plane that passes through the origin. If examine the Figures 6.4, 6.6, 6.8 and 6.9 more carefully, then we notice that there are areas inside the interior circle of the InfoCrystal that do not have any dots. Hence, it appears that for specific relevance values and angles that there are no corresponding documents. The nature of the two surfaces described above enables us to explain why this is the case. We have a cone and a plane that both pass through the origin. These two surfaces will have points in common other than the origin only if the normal of the plane lies inside the space created by a cone with the same angle as the cone that is defined by the relevance score, called the relevance cone, and by sweeping its axis perpendicular to the axis of the relevance cone. Hence, we can easily imagine particular cone orientations and plane normals that only intersect at the origin, and in these cases the corresponding location in the interior of the InfoCrystal will remain empty. The frequency and the particular combinations of relevance scores and angles defined by a center of mass for which this occurs is a function of the chosen relevance weights.
6.4 Discussion
A primary goal of this thesis is to create visual abstractions that can be used both as a visualization tool and as a visual query language. We have shown how the InfoCrystal can be both used to visualize Boolean and vector space queries. The question arises: which parts of the InfoCrystal are used to accomplish this versatility and what are their relationships? In the discrete version of the InfoCrystal the area used for visualization purposes and the one for specifying queries coincide. In the continuous version of the InfoCrystal the interior area is used for visualizing the ranking of the contents of an information space, and the sliders attached to the InfoCrystal are used for specifying the retrieval request. Hence, the visualization and query language components are performed by different visual entities. Finally, the interior can be used for both for visualization and specifying Boolean queries in the case where the InfoCrystal is used to formulate weighted queries. The weight and threshold sliders can be used to specify and control how a weighted query is translated into a Boolean query.