8 Experimental Evaluation ................ 121
- 8.1 Introduction ................ 121
- 8.2 Experimental Design ................ 122
- 8.3 Experimental Analysis ................ 131
- 8.3.1 Paired-Difference T-Test ................ 133
- 8.3.2 Analysis of Variance ................ 133
- 8.4 Analysis of the Experimental Results ................ 137
- 8.4.1 Results for the Recognition Task ................ 137
- 8.4.1.1 Categorical Paired-Difference Scores ................ 138
- 8.4.1.2 Time Measurements ................ 140
- 8.4.1.3 Discussion ................ 142
- 8.4.2 Results for the Generation Task ................ 145
- 8.4.2.1 Generation Task Biased in Favor of Boolean Query Language ................ 145
- 8.4.2.2 Categorical Paired-Difference Scores ................ 147
- 8.4.2.3 Continuous Paired-Difference Scores ................ 150
- 8.4.2.4 Time Measurements ................ 152
- 8.4.2.5 Discussion ................ 155
- 8.5 Lessons Learned and General Discussion ................ 158
- 8.5.1 Difference Between the Two Query Languages ................ 159
- 8.5.2 Conclusion ................ 160
The postscript version of this chapter.
Chapter 8
Experimental Evaluation
8.1 Introduction
In this chapter we will present the experimental design and the results of
the user study that was performed to investigate and evaluate a specific aspect
of the InfoCrystal. The user study consisted of comparing the standard,
text-based Boolean query language with the InfoCrystal, where subjects had to
perform a recognition and a generation task. In each task the
subjects were given a series of natural language statements of the information
needs. In the recognition task subjects had to recognize for each information
need the correct expression from among three possible queries. In the
generation task we required subjects to generate a Boolean or InfoCrystal query
that captured a given information need.
Although this study did not test all the valuable or promising features of the
InfoCrystal, it produced the following useful results: 1) It showed that novice
users, who received only a short, fifteen minutes long tutorial, could
successfully use the novel InfoCrystal interface. 2) The study showed that the InfoCrystal,
even at an early stage of development, performed as well as the familiar
Boolean interface, although the study was biased in favor of the Boolean mode
(see section 8.4.2.1 for discussion). 3) The user feedback concerning the
InfoCrystal interface was very encouraging and it helped to pinpoint possible
improvements.
The Boolean query language is the predominant retrieval language and users have difficulties using it effectively [Borgman 1989]. The InfoCrystal is a novel query language and it offers the possibility, among other things, to formulate Boolean queries in a visual way. However, users need to be able to translate their information need into an InfoCrystal by selecting the appropriate interior icons. The InfoCrystal query language raises these specific questions: Are users able to identify easily which particular interior icons contain the information that they are looking for ? Are users able to distinguish correctly between the different interior icons in terms of how they are or are not related to their current information need ? Both the recognition and the generation task address these questions, where the latter task does it in the most direct fashion. An advantage of the InfoCrystal is that it presents all the possible relationships among several concepts at once. Hence, a user gets a complete overview. However, this can also represent a drawback or hindrance, especially to a novice user: So many choices and which ones are relevant to the current information need ? Hence, users have to be able to identify which selection pattern of the interior icons corresponds to their current information needs.
8.2 Experimental Design
The experiment was conducted by having the subjects first view an interactive presentation, created in MacroMind Director, that explained the purpose of the experiment. It described the Boolean query language and it provided an extensive tutorial of how the InfoCrystal could be used as a query language. Appendix 1 describes the tutorial in detail by showing the actual displays and examples used. We had initially a brief introduction to the InfoCrystal that consisted only of an abstract description of general principles without providing concrete examples. However, the preliminary tests showed that this novel query language needed to be explained in more depth. One of the test subjects responded downright hostile to the InfoCrystal because it had not been explained sufficiently with the help of some concrete examples. On average, it took the experimental subjects fifteen minutes to complete the more extensive tutorial. Second, subjects were asked to perform the recognition task, which was conducted in two parts: first a training experiment in which subjects received feedback on their answers, and then the actual experiment without feedback. Third, subjects performed the generation task, which was also conducted in two parts: first a training experiment with feedback and then the actual experiment without feedback. On average, it took the experimental subjects a little more than an hour to complete the tutorial, the recognition and the generation task. For both tasks and in both the training mode and the actual experiment, each subject was presented with each query in both the Boolean and InfoCrystal mode. This fact enabled us to compute the paired-differences in performance between the two query languages to reduce the noise and unwanted variability in the collected data. Further, a randomized complete block design was used to minimize learning effects. The performance was measured as follows: 1) A score was computed, which reflects how well a selected or generated query agrees with the correct query. 2) The time it took a subject to chose or generate a query was measured.
In both the training and actual experiment, subjects were presented with a natural language description of the information that they had to retrieve. All the examples were drawn from the domain of finding a film in a video store. This choice of query domain helped to make the experiments more realistic and enjoyable for the subjects. Subjects had to either recognize or generate queries that asked for videos satisfying certain features (e.g., "romance", "adventure", etc.). Table 8.1 shows the queries and the detractors used in the actual experiment for the recognition task. Figures 8.1 and 8.2 show the screen designs used to perform the recognition experiment for the InfoCrystal and Boolean mode, respectively. Table 8.2 displays the queries used in the actual experiment for the generation task. It also shows which ones of the interior icons of an InfoCrystal had to be selected to retrieve the requested information. Figures 8.3 and 8.4 show the screen designs used to perform the generation experiment for the InfoCrystal and Boolean mode, respectively.
We faced several challenges when generating the different information needs. First, we had to create queries that would not lead to Boolean expressions that would be too complicated in terms of the degree of nesting, the need to use brackets and to mix the different Boolean operators. Second, we needed to use a language and sentence structure that was not ambiguous in terms of the intended meaning. However, we did not want to generate natural language statements where it would be straightforward for the subjects to infer the Boolean query with little effort by stripping off some of the fill words. It was not always easy to disguise the structure of the Boolean query in the natural language statement. In the recognition task, we tried to counteract this problem, first, by using a different ordering of the features in the queries than was used in the information need statement; and, second, by varying the natural language statements.
In both the recognition and generation task, the training set consisted of
six queries, two with two features, two with three, and two with four. The
queries with two features were presented first, followed by those with three
and finally those with four. The only parameter that was randomized in the
training set was the presentation order of the Boolean or InfoCrystal version
of a query. However, this randomization was restricted to ensure that the two
query languages were presented first in equal numbers within a set of queries
that had the same number of features.
Once the subjects had performed the training experiment, they would perform the
actual experiment, where we also presented two examples with two, three, and
four features, respectively. The order of presentation of these six queries was
fully randomized in terms of their rank. However, it was ensured that the
Boolean and the InfoCrystal versions of a given query were not presented in
successive order. Further, the two query languages were presented first in
equal numbers within a set of queries that had the same number of features.
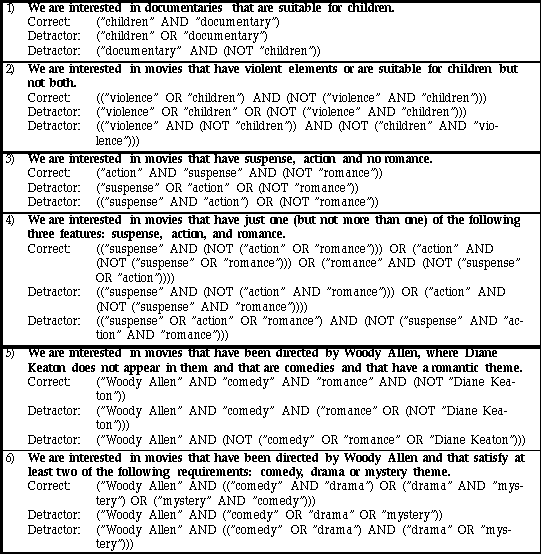
Table 8.1: displays the six queries used for the recognition task, where we have two queries with two, three, and four features, respectively.
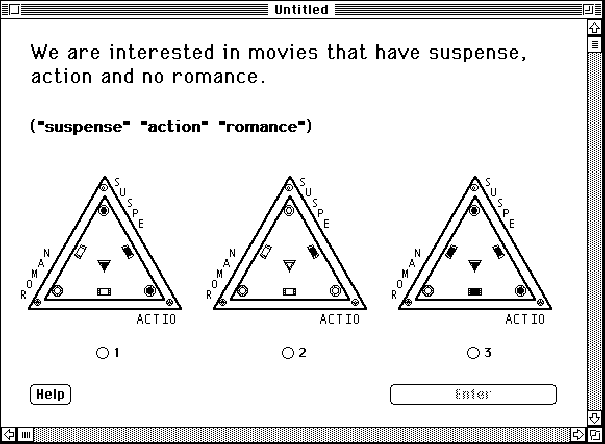
Figure 8.1: shows the recognition task display for the InfoCrystal mode. Subjects had to select the correct choice by clicking on a radio button (for this information need, the second InfoCrystal is the correct choice).
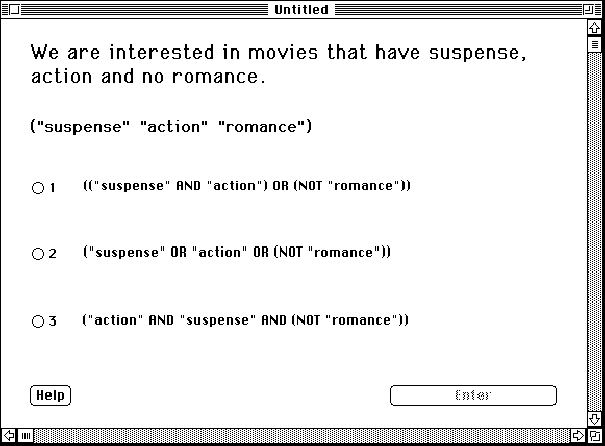
Figure 8.2: shows the recognition task display for the Boolean mode. Subjects had to select the correct choice by clicking on a radio button for this information need, the third query is the correct choice).
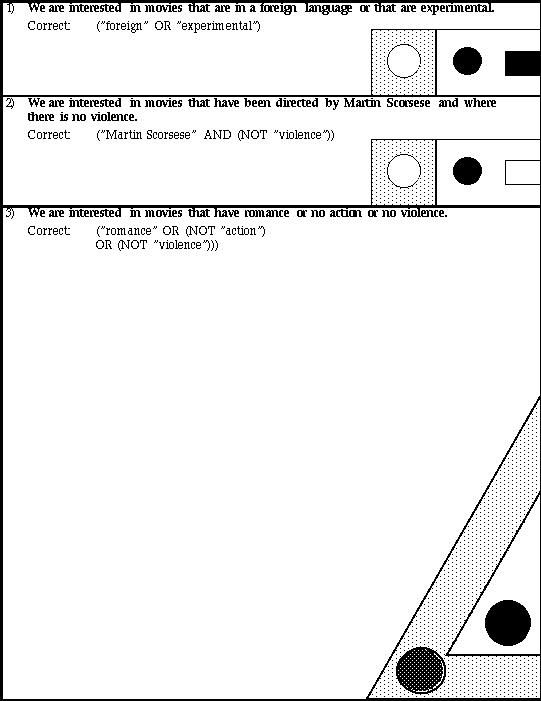
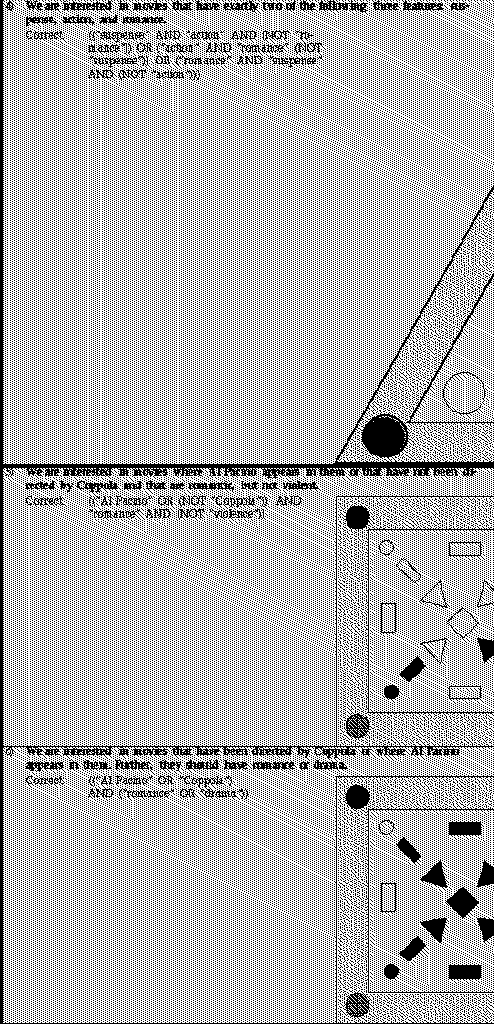
Table 8.2: displays the six queries used for the generation task, where
we have two queries with two, three, and four features, respectively. The
interior icons shown in black need to be selected.
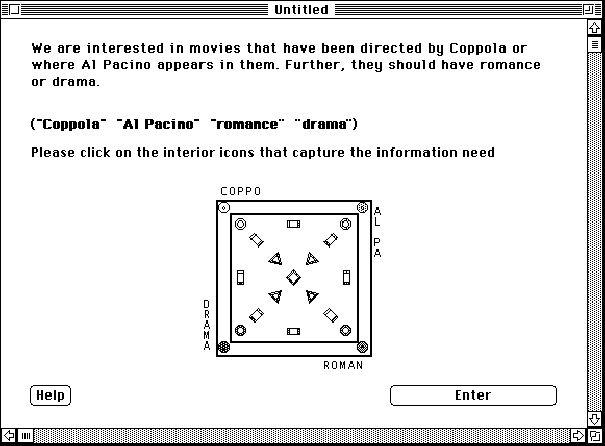
Figure 8.3: shows the generation task display for the InfoCrystal mode. Subjects had to select the appropriate interior icons, where initially none were selected.
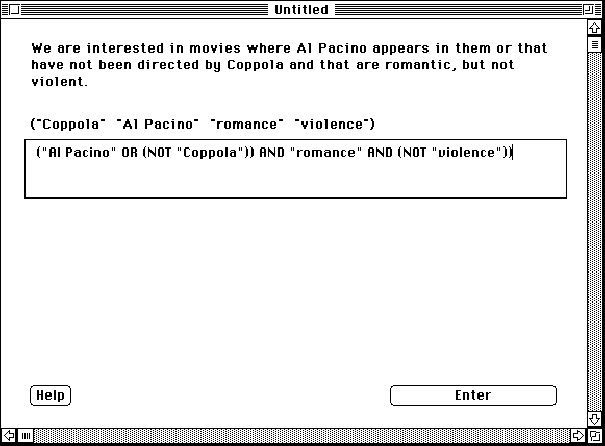
Figure 8.4: shows the generation task display for the Boolean mode. Subjects had to generate the appropriate Boolean expression as shown here.
8.3 Experimental Analysis
The material describing the statistical designs and formulas used to analyze the data is based on the textbook by Montgomery (1991) that deals with the design and analysis of experiments. We deliberately designed the experiments so that each subject was presented with each query in both the Boolean and InfoCrystal mode. This fact enabled us to compute the paired-differences in performance between the two query languages for the same query and for the same subject. Hence, we measured for each subject the relative difference in their performance between the two query languages, and we could use these paired-differences to make a statistical inference. The advantage of the paired comparison design is that we can reduce the noise by being able to focus on the relative performance difference between the two query languages for the same query and the same subject. We thereby increase the homogeneity of the responses and we can better control for the variability among the different subjects in terms of their skills and experience [Montgomery 1991].
Figure 8.5 provides a schematic overview of how the collected data has been analyzed. For each subject, we start out by grouping the scores for all the six queries together and taking their average. Next we only group and take the average the scores for the queries that have the same number of features, and finally we compare the scores for the individual queries. At the coarsest level of analysis we use a Paired-Difference T-Test to infer if there is statistically significant difference between the Boolean and the InfoCrystal query language. For the two other ways of grouping and averaging the data, we use an Analysis of Variance of the paired-difference scores to make statistical inferences. The main purpose for performing the analysis of variance is to investigate if the number of features used in a query affects the performance. Further, we are also interested to see if there are significant differences in performance between the individual queries.
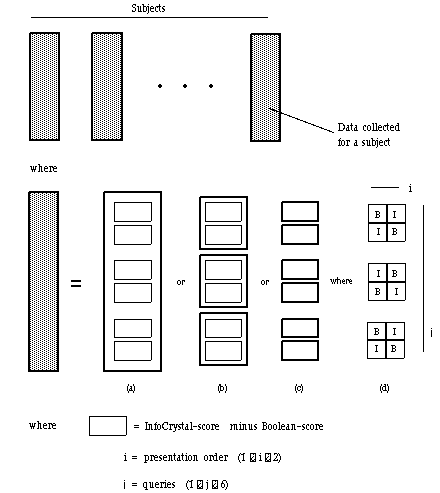
Figure 8.5: shows a schematic overview of how the collected data has
been grouped and analyzed:
(a) We take the average of the paired-differences for the six queries and use
the T-test to test the hypothesis whether the mean is equal to zero.
(b) We take the average of the paired-difference scores for each pair of
queries that have the same number of features. We perform an analysis of
variance (ANOVA) of a single factor at three levels.
(c) We perform an analysis of variance (ANOVA) of a single factor that is equal
to the individual queries, and we conduct the ANOVA at six levels.
(d) We compute the paired-differences by using a 2x2 Latin-Square for the pair
of queries that have the same number of features to ensure that both query
languages are presented first the same number of times.
8.3.1 Paired-Difference T-Test
We first calculate the average of the paired-difference scores for all six queries for each subject. Next we compute the mean of these average and the estimated standard deviation of these averages for all the ten subjects. We then calculate the T-value by dividing the mean by its associated estimated standard deviation. We apply the one-sided T-test because we are interested in the probability that the observed superior performance of a query language could be due to chance. We set the T-level at 5% or 1% and the degree of freedom of the T-distribution is 10 - 1 = 9.
For the paired-difference T-test we use a t-distribution as the test statistic:
![]() =
=
![]()
with (b - 1) degrees of freedom
where b is equal to the number of subjects (in our case ten subjects), and
![]() =
=
![]()
![]() =
=
![]()
where a is equal to the number of queries (in our case six queries), and
![]() =
=

where ![]() is equal to the estimate of the standard deviation.
is equal to the estimate of the standard deviation.
8.3.2 Analysis of Variance
The Analysis of Variance (ANOVA) uses a randomized block design to test if the difference in performance between the two query languages is affected in a statistically significant way by the different treatments. In our case the treatments either correspond to the number of features used in a query or to the individual queries. The ANOVA requires that the treatments are completely randomized within each subject block. Hence, we have a randomization restriction in the form of the subjects. This restriction is important, because it implies that it is not possible for us to test the difference in performance between the different subjects. Furthermore, we can not study the interaction effects between the query languages and the subjects, because we only have one data point for each query and each subject.
The statistical model for the Randomized Complete Block Design is
dij = ![]()
where m is the overall mean, ai is the effect of the ith treatment, bj is the effect in the jth block, and eij is the random error term that is assumed to be normally distributed with mean zero and standard deviation s. Each block corresponds to an individual subject, and a treatment either corresponds to a grouping of queries with the same number of features or to the individual queries, respectively. Hence, a can take the values 3 or 6, and b is equal to the number of experimental subjects, which in our case is equal to ten.
The treatment and block effects are defined as deviation from the overall mean so that
![]() and
and
![]()
which enables us to partition the total sum of squares in the following way:
![]() =
=
![]()
![]() =
=
![]() +
+
![]() +
+
![]()
where
![]() and
and
![]() and
and
![]() .
.
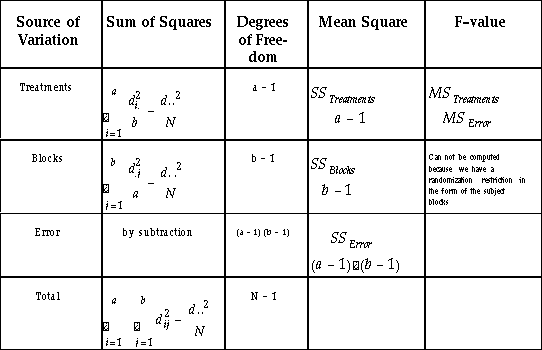
Table 8.3: shows the analysis of variance table, where the total sum of squares is partitioned into the sums of squares for the treatments and block effects as well as the error term. These sums and their associated degrees of freedom are used to compute the mean square values, which in turn can be used to compute the F-value that tells us if the differences between the treatments are statistically significant.
This partitioning of the total sum of squares is used to construct the ANOVA table as shown in Table 8.3. We can compute the degree of variability that is due to the treatments and the blocks, respectively. The remaining variability is attributed to the error term. We can compute the mean square for the different sum of squares by using the degrees of freedom associated with these different sums. Finally, we can calculate the F-value for the treatments to test if the difference in performance between the different treatments is statistically significant.
If we would like to investigate multiple factors and their interactions, then we could use a factorial design. The simplest type of a factorial design involves only two factors. There are a levels of factor A and b levels for factor B, and these are arranged in a factorial design: each replicate of the experiment contains all ab treatment combinations. The model for a two-factor factorial design with one replicate looks exactly like the randomized complete block design. However, the experimental designs that lead to the randomized block and factorial models are very different. In the factorial model, all ab runs have been performed in random order, whereas in the randomized block model, randomization occurs only within the block. Hence, it is not appropriate to analyze our collected data as if it been generated by a factorial design.
8.4 Analysis of the Experimental Results
In this section we present and analyze the results for the recognition and generation tasks, where ten subjects participated in the user study. The sample included four women and six men, where their ages ranged from the early twenties to the middle forties. All the subjects had at least a college education and they had been exposed to the Boolean retrieval language during their education or professional life. In chapter 9 we present a table that summarizes the feedback we received from the subjects and it also contains more information about their background. Although it does not necessarily constitute a representative sample of ordinary users, it is sufficiently diverse to serve as an initial sample to begin to study the effectiveness of the InfoCrystal as a Boolean query language.
8.4.1 Results for the Recognition Task
In the recognition task subjects had to select the correct Boolean or InfoCrystal query from among three possible choices. We computed a score for each query that could take the following categorical values: 1) If a subject chose the correct query or the wrong query for both languages, then the score was set equal to zero. 2) If a subject chose the correct query only when viewing it in the InfoCrystal mode, then the score was equal to plus one; whereas in the opposite case (correct in the Boolean mode and incorrect in InfoCrystal) it was set equal to minus one. Further, we recorded for each query the amount of time it took a subject to make a final selection. We then computed the difference between the recorded time when the query was presented in the InfoCrystal mode minus the time for the Boolean mode. Hence, a negative difference value implied that it took a subject less time to make a selection using the InfoCrystal than using the Boolean interface.
The main conclusion that we can draw from the analysis of the results for the recognition task is that there is no statistically significant difference between the two query languages that can be inferred based on the T-test of either the scores or the time measurements. Further, the analysis of variance of the scores does not show that there is a significant difference that could be attributed to the number of features used in a query or to the individual queries themselves. The only statistically significant difference exists for the analysis of variance of the time measurements, both in terms of the number of features used in a query and the individual queries, respectively.
8.4.1.1 Categorical Paired-Difference Scores
Table 8.4 displays the scores and it clearly shows that the subjects predominately selected the correct query for both query languages with very few exceptions. Hence, it should come as no surprise that the T-test of the average of all six scores is not significant at either the 1% or the 5% level (see Table 8.5). Similarly, the analysis of variance of the scores does not reveal any statistically significant differences between the treatments (see Table 8.6).


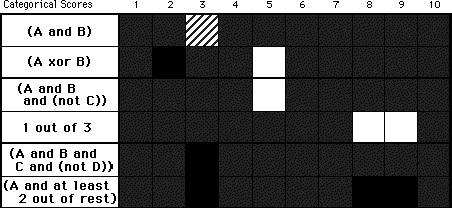
Table 8.4: shows the scores for the recognition task, which have been calculated as follows: 1) If a subject chose the correct query or the wrong query for both languages, then the score was set equal to +O or -O, and this is visualized in the bottom table using a gray or stripped pattern, respectively. 2) If a subject only chose the correct query when viewing it in the InfoCrystal mode, then the score was equal to 1 and was visualized using light gray; whereas in the opposite case it was set equal to -1 and visualized using black. The leftmost column displays the Boolean structure of the queries used in the experiment. The query (A xor B) uses the exclusive OR operator to arrive a shorter expression for this table, although the actual Boolean is more complicated. Finally, we have grouped the queries with the same number of features by enclosing them by a thick black border.
![]()
Table 8.5: shows the mean and the estimated standard deviation of the averages of the scores for the recognition task. The resulting t-value of -0.32 is not significant for a t-distribution with 9 degrees of freedom at the 1% or 5% level, where the corresponding values of the t-distribution are equal to -1.833 and -2.821, respectively, at those levels.


Table 8.6: shows the analysis of variance tables of the scores for the recognition task, where the treatments are either the pairs of queries with the same number of features or the individual queries. The resulting F-values are not significant at the 1% or 5% level for either ANOVA.
8.4.1.2 Time Measurements
Next we examine the time it took subjects to make a final selection from among the three choices. Table 8.7 (a) shows the difference between the time measurements for the InfoCrystal and the time for Boolean version of a query. The table (c) shows the time measurements for the InfoCrystal. The table (d) shows the percentile difference in the time measurements between the two query languages, where we divide the time difference between the query modes by the time for the Boolean mode.
![]()


(b) Time Differences between the two modes represented visually
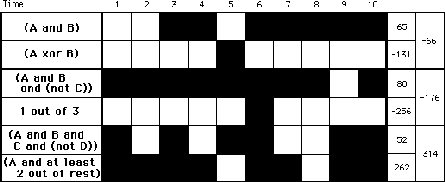


Table 8.7: (a) shows the difference in the time measurements, measured in seconds, between the InfoCrystal and the Boolean query language for each query; (b) displays the time differences in a graphical way, where light gray indicates that the InfoCrystal was faster, and black that the Boolean interface took less time. (c) displays the time measurements for the InfoCrystal; (d) shows the percentile difference between the two query languages by dividing the entries in table (a) by the time measurements for the Boolean mode of a query.
Table 8.8 shows the outcome of performing the T-test on the average of all six time differences between the two query languages and it is not significant at either the 1% or 5% level.
![]()
Table 8.8: shows the mean and the estimated standard deviation of the averages of the time difference for the recognition task. The resulting t-value of 0.53 is not significant for a t-distribution with 9 degrees of freedom at either the 1% or 5% level.


Table 8.9: shows the analysis of variance tables of the time measurements for the recognition task, where the treatments are either the pairs of queries with the same number of features or the individual queries. The resulting F-values are both significant at the 5% and the 1% level for either ANOVA, where the corresponding values of the F-distribution are equal to 2.43 and 3.5, respectively, at those levels.
However, the analysis of variance of the time differences does reveal that there is a statistically significant difference between the treatments (see Table 8.9). Some queries took longer with the Boolean interface and others took more time with the InfoCrystal.
8.4.1.3 Discussion
If we examine Table 8.7 (a) more carefully, then we can identify the following three clusters: 1) The second and fourth query clearly take less time in the InfoCrystal mode. The superior time performance can be explained by the fact that these two queries are easy to represent and recognize in an InfoCrystal, whereas they require the recognition of quite complicated query expressions in the Boolean mode (see Table 8.10). 2) The first, third and fifth query take slightly less time in the Boolean mode. This can be attributed to the fact that the natural language statements can be translated in a quite straightforward way into a Boolean query. These queries primarily use the AND operator and at times the NOT operator, whereas the occurring NOT operators require a greater cognitive effort for novice users when using the InfoCrystal. 3) The sixth query clearly takes less time in the Boolean mode. This query has a hybrid structure because it combines requirements that are easy to express using the Boolean mode (e.g., "A AND ...") as well as ones that are easier to express using the InfoCrystal (e.g., "at least n out of m features"). Subjects have to be able to superimpose these two requirements when using the InfoCrystal, which can be especially challenging for novice users. In practice, it would be easier to construct a hierarchical query as shown in Figure 8.4, but that option, although implemented, was not made available to the subjects.
The analysis of variance of the time differences indicates that there are significant differences depending on the number of features used in a query. Looking at the rightmost column in Table 8.7 (a) we can see why this inference is possible. The grouped scores (-66, -176, and 314) are sufficiently different. However, the above discussion indicates that it would be more appropriate to distinguish between queries that are easier to represent in the
![]()
Table 8.10: The first two rows show the two queries for which the InfoCrystal took less time than the Boolean mode. These queries are easy to represent in an InfoCrystal, whereas they require quite complicated query expressions in the Boolean mode. The bottom row shows the query for which the Boolean mode takes less time. This query has a hybrid structure because it combines requirements that are easy to express using the Boolean mode (e.g., "A AND ..."), and also ones that are easier to express using the InfoCrystal (e.g., "at least m out of n features").
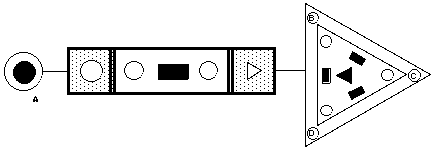
Figure 8.6: shows a hierarchical InfoCrystal query that is equivalent to the InfoCrystal query shown in Table 8.10 (third row), but that is easier to program so as to represent the specified information need (A and at least 2 out of 3 remaining).
InfoCrystal than in the Boolean mode and vice-versa. Furthermore, the queries that use two or three features, respectively, do not consistently have a faster performance in the InfoCrystal. Actually, both groupings have a query that takes less time in the Boolean mode and one in the InfoCrystal mode, respectively. However, the latter ones take much less time than the former ones, causing the time difference for these grouping to be in favor of the InfoCrystal.
These experiments have helped us to understand better for which types of queries the InfoCrystal might be better suited. For example, the InfoCrystal is ideally suited for "m out of n features" types of queries. Further, the experiments suggest that users could benefit from a hybrid interface, where they could simultaneously use a Boolean and an InfoCrystal interface to formulate queries. This observation is also clearly articulated in the feedback received from the experimental subjects (see Chapter 9).
8.4.2 Results for the Generation Task
In the generation task subjects had to create the correct Boolean or InfoCrystal query based on a textual description of the information need. A key issue we had to address is how to determine a score for the generated queries in both modes and how to compute the paired-difference score. We decided to make use of the fact that any valid Boolean query can be visualized in an InfoCrystal, causing the interior icons to be selected in a unique way. Hence, we can represent the correct query and any generated valid Boolean query in the form of InfoCrystals, and we can compute a score that reflects to what degree their associated selection patterns of the interior icons overlap. If they overlap perfectly, then the score is equal to one. If the selection patterns are just the inverse of each other, then the score is equal to zero.
We considered two ways of using these scores to compute the paired-difference score: 1) We assigned a categorical value of one if the InfoCrystal mode had a higher score, zero if both modes had the same score, and minus one if the Boolean mode had the higher score. 2) We simply set it equal to the difference between the scores for the two query languages.
As for the recognition task, we recorded for each query the amount of time it took a subject to perform the generation task. We then computed the difference between the recorded times for the InfoCrystal and the Boolean mode. Hence, a negative difference value implied that a subject took less time to create the query using the InfoCrystal than using the Boolean interface. The subjects had to use a standard command line interface to enter the Boolean queries, which could be a time consuming and tedious task. Hence, we would expect that the Boolean interface would require more time, especially for queries that use less than four features. However, there will come a point where the InfoCrystal is just as time consuming to program, because it contains so many interior icons that a subject has to consider. The time data reflects our expectations [see Table 8.17].
8.4.2.1 Generation Task Biased in Favor of Boolean Query Language
In order to translate a generated Boolean query into the InfoCrystal, we had to ensure that the subjects only submitted valid Boolean queries. We accomplished this by automatically testing the validity of the generated queries and giving the subjects feedback on how to modify currently invalid queries. However, we thereby eliminated a major source of errors that occur when creating Boolean queries [Borgman 1989, Young and Shneiderman 1993]. Young and Shneiderman [1993] found that almost half of the errors they observed in a similar generation task could be attributed to scoping errors or unbalanced parentheses. In essence, we focused only errors in the choice of the Boolean operators, whereas subjects usually also experience great difficulty in applying the brackets appropriately to achieve the desired nesting and to scope the operators correctly.
Hence, the generation task was biased in favor of the Boolean mode, because we only accepted and recorded valid Boolean queries, thereby eliminating a common source of errors. One of the advantages of the InfoCrystal is that any selection pattern of the interior icons corresponds to a valid Boolean query. We made the choice to only accept valid Boolean queries, because we wanted a consistent and fair way of scoring and comparing the generated queries in both modes. We also did not want to bias the experiment against the Boolean mode by assigning a score of zero to queries that are invalid because of mistakes in the placement of parentheses. To bias the experiment in favor of the Boolean mode represented to us a lesser evil, because we wanted to test if the InfoCrystal could be an effective interface to formulate Boolean queries.
The generation experiment was further biased in favor of the Boolean mode for the following reason. For queries that require a large percentage of the interior icons to be selected, it is easier to achieve a decent score by generating a valid Boolean query that is not perfectly coordinated than it is for the InfoCrystal. It is easy to fail to select all the icons that need to be selected, where this problem gets worse, the more icons that need to be selected. Table 8.21 reflects this fact because it shows that the major source of error for the InfoCrystal could be attributed to the fact that the subjects did not select all the necessary icons.
The main conclusion that we can draw from the analysis of the results for the generation task is that there is a statistically significant difference between the two query languages in favor of the Boolean mode. This should come as no surprise based on the above discussion. The analysis of variance for both treatment types was statistically significant. As was the case for the recognition task, there were queries for which one of the two query languages performed much better. We had three such queries for the Boolean mode and one for the InfoCrystal. This fact was yet another reason why the Boolean mode performed better overall. Two of the queries favoring the Boolean mode required the selection of many of the interior icons, implying that it was easy for the subjects to miss selecting some of them in the InfoCrystal mode. For the query that was easier to express in the InfoCrystal, subjects tended to generate incorrect Boolean queries that hardly penalized the subjects in terms of the score, because their common mistake just had the effect that one icon was not selected that should have been. For the queries that favored the Boolean mode, the common mistakes in the InfoCrystal resulted in much lower scores.
A statistically significant difference could be detected in favor of the InfoCrystal for both the T-test and for the two analyses of variance of the time measurements. This result has to interpreted with caution, because the standard Boolean interface used in this experiment required users to do quite a bit of typing, which was a tedious and time consuming task (the user feedback reflected this as well). Another advantage of the InfoCrystal is that it requires users only to select the appropriate interior icons, where the word "only" needs to be put in context: the larger the number of interior icons, the more time consuming and demanding it becomes for users to select all the correct icons.
8.4.2.2 Categorical Paired-Difference Scores
In this section we present and analyze the categorical paired-difference scores. Table 8.11 shows the actual scores. There are three queries that have mostly scores of -1, implying that the Boolean mode performed better, and there is one query that has predominately ones. We will examine these queries in more detail in Table 8.20. The T-test of the average of all six categorical paired-difference scores is only significant at the 5% but not at the 1% level (see Table 8.12). The analysis of variance of the scores does reveal a statistically significant difference between the treatments that are either the pairs of queries with the same number of features or the individual queries (see Table 8.13).

![]()
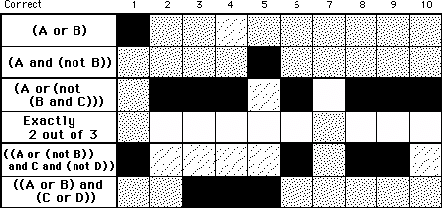
Table 8.11: the top table shows the categorical scores for the generation task, which have been calculated as follows: we assign a categorical value of 1 if the InfoCrystal mode has a higher score, 0 if both modes have the same score, and -1 if the Boolean mode has the higher score. The leftmost column displays the Boolean structure of the queries used in the experiment. We have also grouped the queries that use the same number of features by enclosing them by a thick black border. The bottom table shows in a graphical way, using light gray, for which queries the generated InfoCrystal query was correct and had a better score than the Boolean one. Similarly, black indicates where the Boolean mode was correct and had a better score. If a subject generated the correct query or the wrong query for both languages, then this is visualized in the bottom table using a gray or stripped pattern, respectively.
![]()
Table 8.12: shows the mean and the estimated standard deviation of the averages of the categorical scores for the generation task. The resulting t-value of -2.75 is only significant for a t-distribution with 9 degrees of freedom at the 5%, but not at the 1% level, where the corresponding values of the t-distribution are equal to -1.833 and -2.821, respectively.


Table 8.13: shows the analysis of variance tables of the categorical scores for the generation task, where the treatments are either the pairs of queries with the same number of features or the individual queries. The resulting F-values are significant at the 5% and the 1% level for either ANOVA.
8.4.2.3 Continuous Paired-Difference Scores
In this section we examine the continuous paired-difference scores for the two query languages. They are computed by taking the difference between the scores for the InfoCrystal and the Boolean version of a query. These individual scores reflect the degree of overlap between the selection patterns of the interior icons for the generated and the correct query. We obtained very similar results as for the categorical paired-difference scores. The only major difference is that here the analysis of variance did not detect any difference between the queries that use a different number of features.

![]()
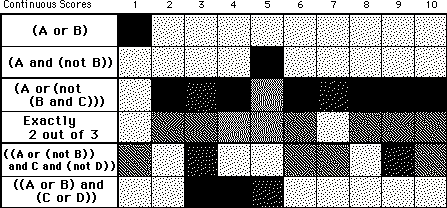
Table 8.14: the top table shows the continuous paired-difference scores for the generation task, which have been calculated by just taking the difference between the score for the InfoCrystal and the Boolean version for the same query. The bottom table displays the same scores in a graphical way, where gray represents zero and a gray tone closer to black / white implies that the Boolean / InfoCrystal interface performed better, respectively.
![]()
Table 8.15: shows the mean and the estimated standard deviation of the averages of the scores for the generation task. The resulting t-value of -3.30 is significant for a t-distribution with 9 degrees of freedom at both the 5% and the 1% level in the favor of the Boolean mode.


Table 8.16: shows the analysis of variance tables of the scores for the generation task, where the treatments are either the pairs of queries with the same number of features or the individual queries. The resulting F-values are significant at the 5% or the 1% level for only the ANOVA, where the treatments are equal to the individual queries.
8.4.2.4 Time Measurements
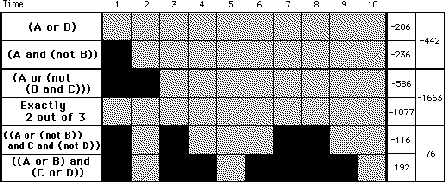
In this section we examine the amount of time it took subjects to generate a query. Table 8.17 (a) shows the difference between the time measurements for the InfoCrystal and Boolean version of a query; (c) shows the time measurements for the InfoCrystal; (d) shows the percentile difference in the time measurements between the two query languages. We have already mentioned that these time differences have to be interpreted with caution, because the standard Boolean interface used in this experiment required users to do quite a bit of typing, which can be a tedious and time consuming task.
![]()

![]()
(b) Times difference between the two modes represented visually

![]()

![]()
Table 8.17: (a) shows the difference in the time measurements, measured in seconds, between the InfoCrystal and the Boolean query language for each query. (b) displays the time differences in a graphical way, where light gray indicates that the InfoCrystal was faster, and black that the Boolean interface took less time. (c) displays the time measurements for the InfoCrystal. (d) shows the percentile difference between the two query languages by dividing the entries in table (a) by the time measurements for the Boolean mode of a query.
Table 8.18: shows the outcome of performing the T-test on the average of all six time differences between the two query languages. It is significant at both the 5% and 1% level in favor of the InfoCrystal. The analysis of variance of the time differences does also reveal a statistically significant difference in favor of the InfoCrystal between the treatments, where the treatments are either the pairs of queries with the same number of features or the individual queries (see Table 8.19).
![]()
Table 8.18: shows the mean and the estimated standard deviation of the averages of the time difference for the generation task. The resulting t-value of -4.06 is significant at the 5% and the 1% level.


Table 8.19: shows the analysis of variance tables of the time measurements for the generation task, where the treatments are either the pairs of queries with the same number of features or the individual queries. The resulting F-values are both significant at the 5% and the 1% level for either ANOVA.
8.4.2.5 Discussion
As for the recognition task, it is instructive to examine the queries for which one of the query languages clearly performed better. Table 8.20 shows in its top row the query that subjects found easier to formulate using the InfoCrystal. This query is of the type "m out of n" that can be quite cumbersome to express using the Boolean mode. The other rows show the queries where the subjects consistently performed better using the Boolean mode.
![]()
![]()
Table 8.20: The first row shows the query for which the InfoCrystal has a clearly better score than the Boolean mode, because it is easy to represent it in an InfoCrystal, whereas it requires the formulation of a quite complicated query expression in the Boolean mode. The other rows show the query for which the Boolean has a better score. Two of these queries require the selection of many interior icons in the InfoCrystal mode, where it is easy for the subjects to fail to select all the necessary ones.
We examined all the queries generated by the subjects that were not correct. There are two types of errors that occurred: 1) The incorrect query does not select all the necessary relationships among the features (see Misses column in Table 8.21). 2) The incorrect query in effect includes unwanted relationships (see False Alarms column in Table 8.21). We have noted that the number of interior icons increases exponentially as the number of concepts or features increases. Consequently, there will come a point, where it will be quite demanding for the subjects to explore all the interior icons to generate a query without missing some of the icons that need to be selected. Hence, we expect that the subjects tend to fail to select all the necessary interior icons instead of selecting unwanted interior icons (assuming that initially all the interior icons are not selected).
![]()
Table 8.21: An incorrect query can be characterized in terms of the relationships between the features that it failed to select, i.e., the misses, and the ones it should not have selected, i.e., the false alarms. This table shows the number of interior icons that were missed or incorrectly selected in all the incorrect queries generated by the subjects for both query languages. The number in the brackets refers to the number of interior icons that were missed by the incorrect queries generated for the third query in the InfoCrystal mode. As we have discussed in Table 8.20, for this particular query the subjects found it difficult to elaborate all the possible relationships as they pertained to this query. Hence, they chose a conservative strategy to select only those icons that clearly satisfied the information need.
8.5 Lessons Learned and General Discussion
In a certain respect, the InfoCrystal is more demanding than the Boolean mode, because it requires users to really understand the structure of the information need, whereas subjects could often "copy" the textual information need to create a textual Boolean query without really having to fully understand the implication of its logical structure. Ideally, we would like to phrase the information needs in a way that required an equivalent effort to translate them into the Boolean query and the InfoCrystal mode. Hopefully, in a future experiment we can create such a set of information needs.
We purposely chose to have the subjects use a version of the InfoCrystal that did not have the enhancing features to be outlined below and elsewhere in this thesis, because we wanted to see how well they could use the InfoCrystal in its most basic form to translate the specific information needs into the appropriate selection pattern of the interior icons. The feedback received from the subjects asked for some of the features outlined below and it can serve as an independent confirmation that these features could make the InfoCrystal a more effective tool.
One of the arguments presented in favor of the InfoCrystal is that it does
not require users to think in terms of Boolean algebra to formulate a query.
They can think spatially and they need to decide which parts of the space of
relationships that they want to explore by selecting the corresponding interior
icons. There are, however, instances where users have to be able to translate a
specific information need, as was the case in these experiments, or they have a
set of preferences and they need to figure out how to program the InfoCrystal
accordingly. Hence, it is worth stressing at this point that the InfoCrystal
has been or can be easily extended in the following ways to assist users in the
task of "programming" it:
First, the InfoCrystal has the built-in capability to show the Boolean query
that is equivalent to the current selection pattern of the interior icons.
Hence, users can interact with the interior icons and thereby incrementally
create the desired Boolean meaning. There are, however, many ways of writing
Boolean queries that have equivalent meanings. One of the issues that needs to
be further investigated is how to reduce a Boolean query to a form that
expresses its meaning in the most concise way. There are methods for performing
this reduction process automatically, and we will implement them in our future
research.
Second, if users are able to formulate a Boolean query that reflects their
information need but they do not know how to represent it in an InfoCrystal,
then we have developed a mechanism that can perform the translation
automatically. Actually, we can translate any valid Boolean query into an
InfoCrystal and vice-versa.
Third, if users do not know how to formulate a Boolean query, but they feel
comfortable assigning relevance weights to the concepts, then we can use these
weights to rank and select the interior icons that are above a certain
threshold. The weights could also be computed automatically, using techniques
employed by statistical retrieval approaches.
Fourth, users can click on the criterion icon and by holding down certain keys
they can formulate a subset of Boolean queries in a similar way that they use
calculator to add and subtract numbers by operating on the current value held
in the accumulator (as discussed in section 4.2.2)
8.5.1 Difference Between the Two Query Languages
The fact that there are queries that are easier to formulate using one of the two query languages encouraged us to analyze the difference between the Boolean and the InfoCrystal query languages in a little more detail. The following observation can help us to understand some of their differences: On the one hand, the InfoCrystal operates at the lowest possible level of abstraction, because it represents all the possible queries in disjunctive normal form. Its interior icons represent the disjoint constituents that are the necessary and sufficient to create any query. On the other hand, the Boolean query operates at higher level of abstraction. Hence, it makes it easy to express certain high-level statements that will require more work to be pieced together by selecting the appropriate interior icons. However, there are very specific and complex queries that are very cumbersome to formulate using these more general or bulky Boolean constructs.
An alternate, but related way of understanding the difference between the InfoCrystal and Boolean query language is to use a geometrical analogy. On the one hand, the interior icons can be thought of as the atomic shapes out of which any geometric shape can be created. On the other hand, the components in a Boolean query constitute larger shapes that make the creation of certain shapes very straightforward, but are difficult to use and coordinate when a complex shape needs to be created. To help the reader understand this analogy better, we can think of a specific shape as being defined by a particular subset of selected interior icons and vice-versa. In particular, if we include feature "A" in a Boolean statement, then we activate all the interior icons or constituents that contain "A" in a positive way. If the NOT operator precedes "A", then it just reverses the activation pattern and activates all the interior icons or constituents that do not contain "A". Hence, we can imagine that each concept in a Boolean statement has a selection pattern of the interior icons associated with it. In order to determine the final selection pattern, we need to integrate these different selection patterns. If two concepts are connected by the AND operator, then we intersect the selection patterns associated with concepts. If two concepts are connected by the OR operator, then we take the union or merge the selection patterns associated with the concepts.
8.5.2 Conclusion
The recognition and the generation task only tested a specific aspect of the
InfoCrystal interface and they did not test all of its valuable or promising
features. Still, this user study has produced the following useful results:
1) Although novice users received only a short, fifteen minutes long tutorial,
they were able to successfully use the InfoCrystal. This second version of the
tutorial made a big difference in terms of how well and quickly users could
learn to use the InfoCrystal. Further improvements in the way novice users are
instructed to use the InfoCrystal will help them to make full use of its rich
set of features and the advantages that it has to offer. 2) The study showed
that the InfoCrystal, even at an early stage of development, performed as well
as the familiar Boolean interface, although it was biased in favor of the
Boolean mode (as discussed in section 8.4.2.1). 3) On the one hand, the user
study confirmed that the InfoCrystal is ideally suited for queries of the form
"at most, exactly, or at least n out of m features". On the other
hand, the study showed that certain Boolean queries are more difficult to
formulate using the InfoCrystal than the Boolean interface. However, we believe
that users can improve their performance with more practice and if they have
access to the enhancing features of the InfoCrystal that have been implemented,
but were not made available during the experiments. 4) The user feedback
concerning the InfoCrystal interface was very encouraging and it helped to pinpoint
possible improvements (see chapter 9).
We plan to conduct further user studies that will examine the ability of users to reformulate queries. We expect that the InfoCrystal should perform well and demonstrate how it supports the query reformulation process. The InfoCrystal makes it easy to broaden or narrow a query, because it represents all the possible queries in a single display. A major advantage of the InfoCrystal is that it uses a simple metaphor to visualize the broadness of a query: the larger the visual area, the broader the query. In other query languages, such as the Boolean one, it is much more demanding and cumbersome to broaden or narrow a query. It can require a deep understanding of these query languages. Furthermore, the InfoCrystal has the attractive quality that enables users to better predict what the consequences of certain changes will be. This is not necessarily the case with other query languages.
Although it is easy to broaden or narrow an InfoCrystal query, there are multiple ways to achieve it. We are again faced with the fact that users have to understand the meaning of the interior icons to be able to modify an InfoCrystal in a precise and desired way. Users can use the quantitative information associated with the interior icons to help them decide how to modify an InfoCrystal, provided their main concern is to change the amount of information that is being retrieved. If, however, they want to change the structure of the retrieved information, then one of the prerequisite is that they understand the meaning of the interior icons. Hence, the recognition task and generation task did address an issue central to the successful use of the InfoCrystal.
To conclude, we hope to implement the InfoCrystal in an environment that enables us to use it as front-end to several and diverse retrieval engines that can rapidly search large information spaces. We believe once we can use the InfoCrystal to explore large information spaces in real-time that some of its advantages and strengths can be more fully demonstrated and that the further improvements will suggest themselves.